Scenario Validation Matrix – Quadrant Counts

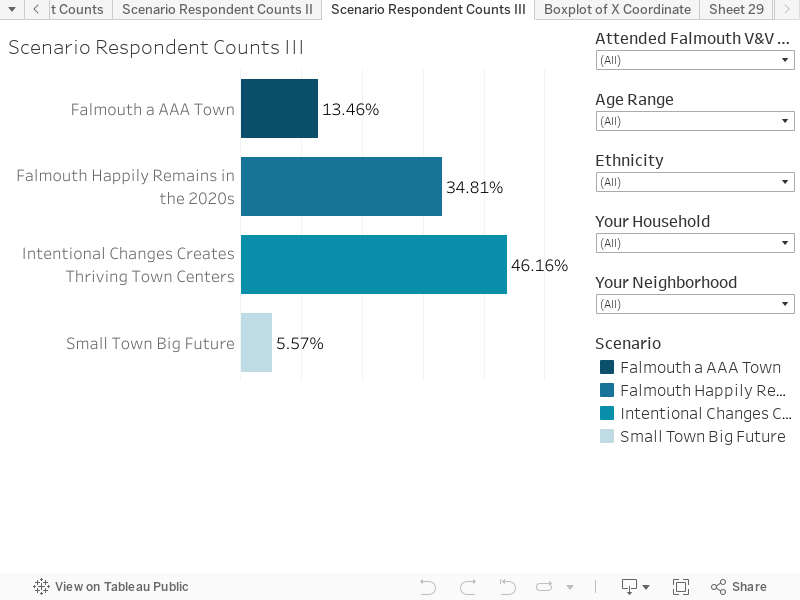
This chart shows the responses for the scenario validation matrix. These are grouped in counts by scenario quadrant.

Key things to note:

  • The quadrant counts summarize the data in a slightly different presentation format.
  • The data further supports the conclusion that Scenario B: Intentional Change Creates Thriving Town Centers, represents the preferred future.

MORE INFORMATION​

For more information about the Town of Falmouth Vision and Values project, please contact:

David Beurle, CEO
Future iQ
Phone: (612) 757-9190
david@future-iq.com