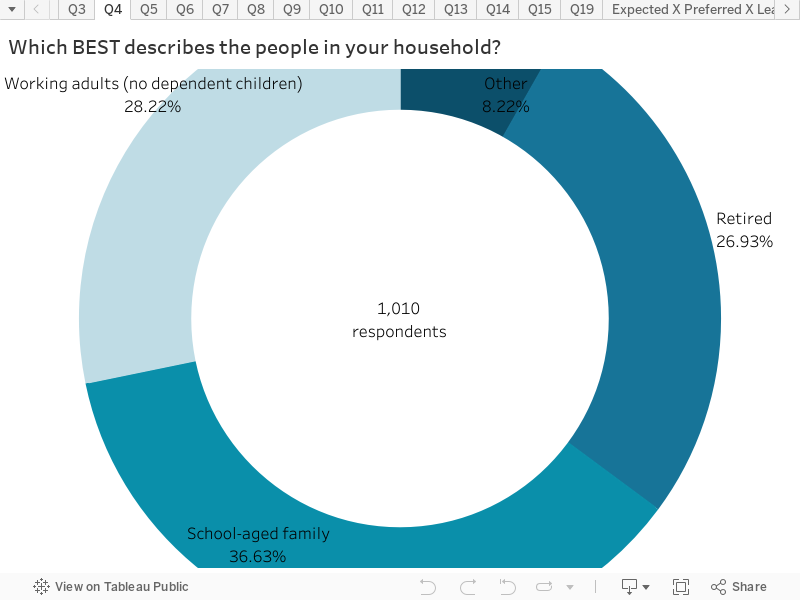
This chart shows the types of people in the respondents household.
Almost 37% of respondents were households of school-aged families.
Approximately 28% were working adults households.
27% of households were retirees.
For more information about the Town of Falmouth Vision and Values project, please contact:
David Beurle, CEOFuture iQPhone: (612) 757-9190david@future-iq.com