In addition to the scenario heat maps, Community Survey #2 explored a range of key themes or issues. Approximately 950 people completed that full set of questions. The questions were drawn from the scenario matrix descriptions and were presented as continuum questions around six major themes, three from each axis. The key topic questions were framed based on the following topics:
Built Environment
Community Infrastructure
Transportation
Future Development
Community Outlook
Orientation and Outlook
Community Focus and Fabric
Community Reputation
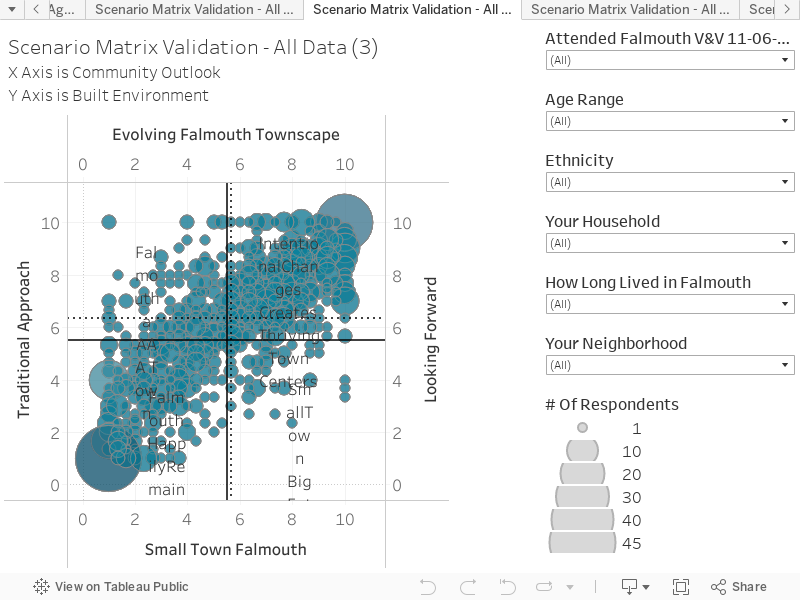
Each of the key topic questions were presented as 1-10 ranges, reflecting the text describing the end point of each axis. People were asked to record their preference, for that topic, on its continuum. For each person’s responses, the answers to the questions were averaged based on the groupings above and plotted over the scenario matrix. For example, if someone scored all three topics under the Built Environment category as 2 on the scale of 1 to 10, their combined average x-axis responses would be 2.
The resulting “scenario validation matrix” is a way to explore what might be the cumulative results of responses to a range of individual issues, and how it compares to the more intuitive and aspirational preferred future heat maps. This provides a validation or back-up analysis, to ensure the heat map data of the Preferred Future is reflective of real-life responses and issues.
Key things to note:
The scenario validation matrix data shows consistent patterns with the heatmaps. This includes the polarization of responses in the lower left and the upper right of the scenario matrix.
It also reflects the concentration of responses in the Scenario B quadrant area.
The dotted line represents the overall average of responses.
The underlying pattern of cohort responses is similar, and can be explored using the filters on the right hand side.