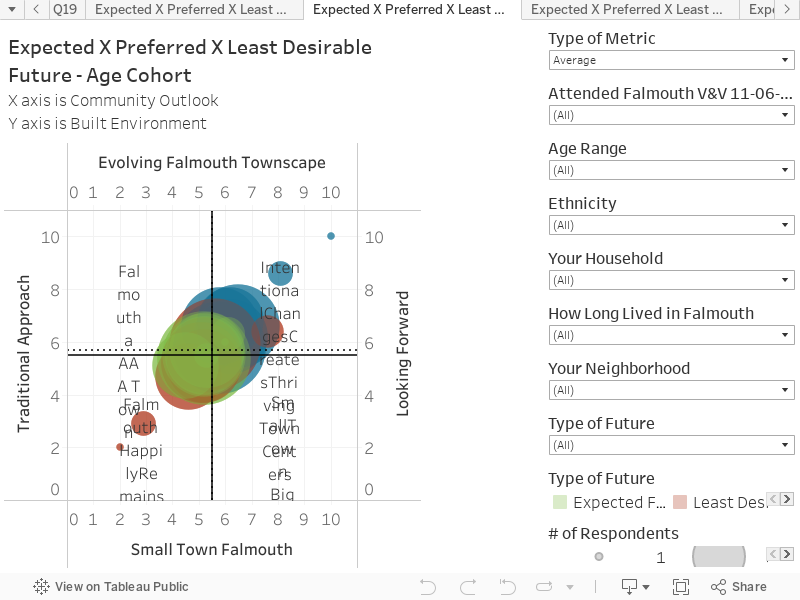
This chart shows the responses to the future scenario questions in Community Survey #2. The chart represents all responses, for the Expected, Preferred and Least Desirable Futures. These are groups in Age Cohorts.
Key things to note:
This approach averages the responses by age cohort for each type of future .
On the top left of the filter column, there is a selection called ‘Type of Metric’. This will allow viewing of Average or Median, which is shown as a dotted line on the chart.