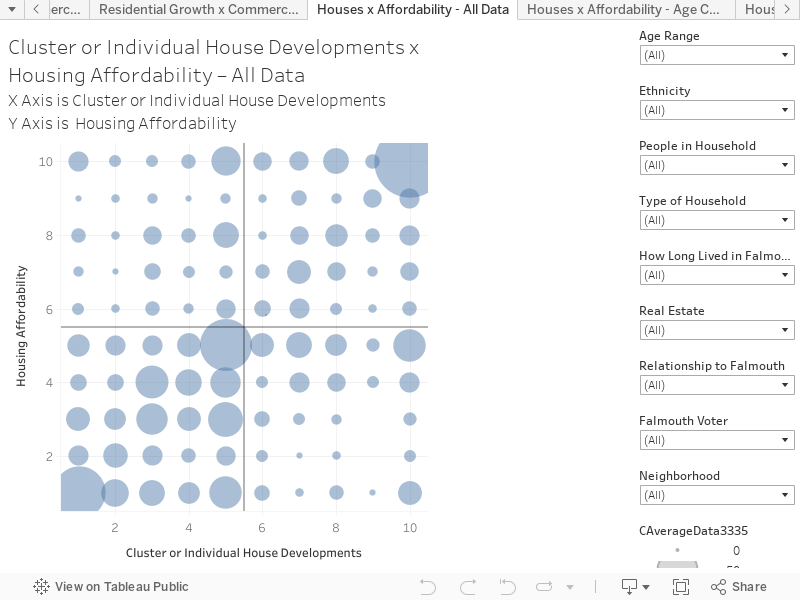
This chart combines two future splitting questions:
X Axis = Cluster or Individual house developments. The question was: “Should Falmouth prioritize development patterns that create cluster type neighborhood developments (with closer detached homes, and more shared amenities and green space), or developments that spread out with larger self-contained individual homes on larger lots?” SCALE: 1 = Cluster-type Developments; 10 = Larger individual home lots.
Y Axis = Housing Affordability. The question was: “Should Falmouth aim to provide more housing that is affordable for lower and middle-income residents, or preserve and enhance existing home values?” SCALE: 1 = More affordable housing; 10 = Enhance existing home values.
Key things to note:
The data on this chart shows a wide spread of view and the topics of House development types, and housing affordability.
There is a significant concentration of responses on the lower left quadrant, which reflects an interest in cluster type developments and offering more affordable housing to lower and middle income residents.
There is a significant bubble of nearly 160 responses on upper right corner (10,10 point) which reflects a desire to focus on larger individual home lots, and enhance existing home values.