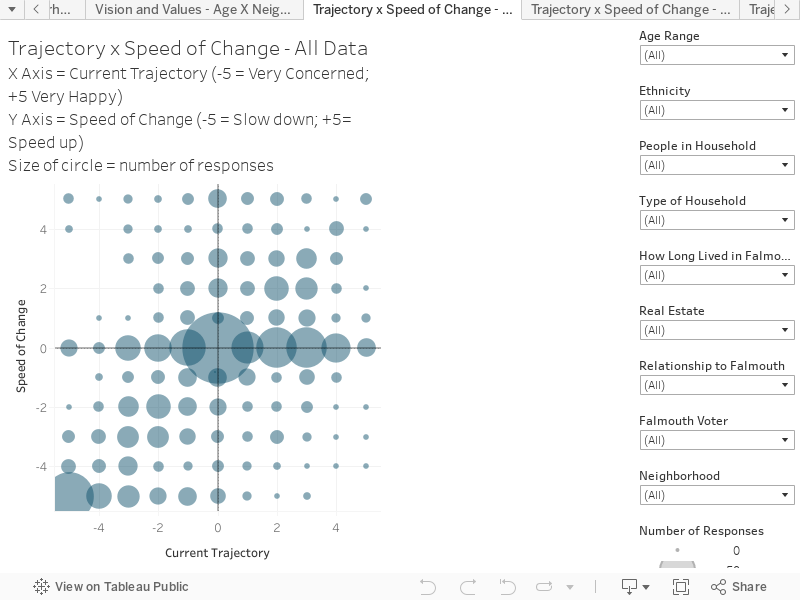
Current Trajectory (X Axis) x Current Speed of Change (Y Axis)
This chart combines responses to two questions to create an interactive scatter plot. This chart presents the average results based on all respondents. You can hover over the chart to reveal more information on each circle.
The chart is structured as follows:
X-Axis is the response to the question “Considering the current trajectory of the community (thinking about changes and where the community has been/is heading), how happy or concerned are you about the OVERALL current trajectory?”. The scale is: -5 = Very concerned; 0 = Neutral; 5 = Very happy
Y-Axis is the response to the question “Thinking about the current (or recent) speed of change in Falmouth, OVERALL do you think Falmouth is changing too quickly (where it is overwhelming the community) or too slowly (where Falmouth is getting left behind)?”. The scale is: -5 = We need to slow down; 0 = Neutral; 5 = We need to speed up
Key things to note:
There is a generally wide spread of views on the questions about the community trajectory and the speed of change.
Overall, the majority of views are concentrated in the middle area, suggesting the majority of people are generally neutral regarding terms of concerns about trajectory or speed of change.
However, there is a cluster of responses that represent about 10% of overall responses, that are in the -3 x -3 section of the chart. This group of people sees higher levels of concern about the trajectory and speed of change in the community.