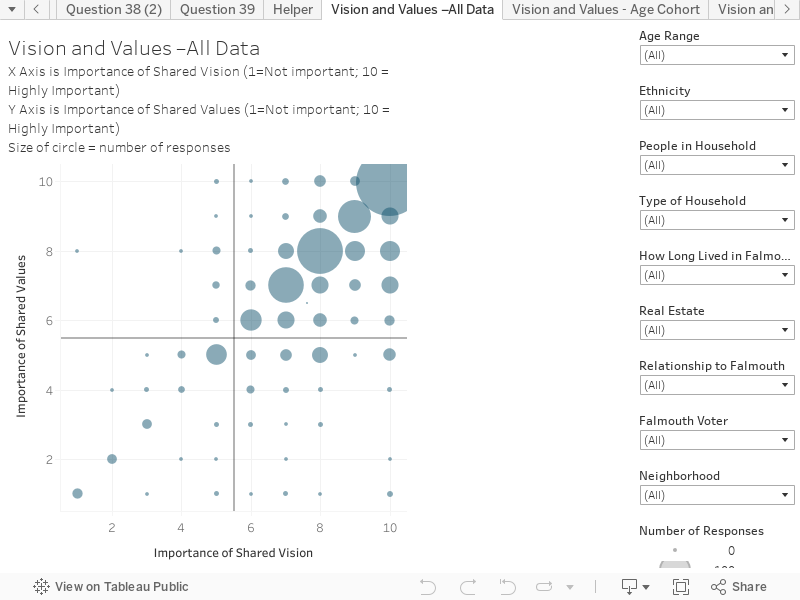
Importance of Shared Vision (X Axis) x Importance of Shared Values (Y Axis)
This chart combines responses to two questions to create an interactive scatter plot. This chart presents the average results based on all respondents. You can hover over the chart to reveal more information on each circle.
The chart is structured as follows:
X-Axis is the response to the question “Overall, how important do you think it is to create a SHARED VISION for the future of Falmouth, that is understood and shared by residents?”. The scale is: 1 = Not Important; 10 = Highly Important
Y-Axis is the response to the question “Overall, how important do you think it is to create SHARED VALUES for Falmouth that are understood and shared by residents?”. The scale is: 1 = Not Important; 10 = Highly Important
Key things to note:
Most respondents saw Vision and Values of similar importance (hence the dominance of responses along the upper right diagonal line on the matrix).
The vast majority of responses see having Shared Vision and Shared Values as important.
This data suggests overall support for the Value and Vision process, as it will be addressing this very topic.