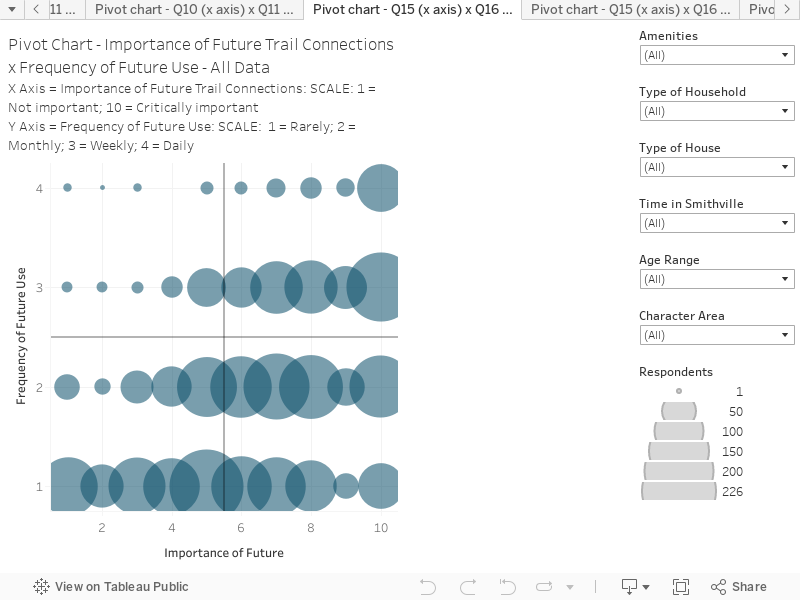
This chart combines responses to two questions (about future importance and frequency of use) to create an interactive scatter plot. You can hover over the chart to reveal more information on each circle.
This chart presents all data.
The chart is structured as follows:
X-Axis is the response to the question “Over the next 5-10 years, how important do you think it is for the community to complete the following main multimodal TRAIL connections? (Multimodal in this context means different compatible transport methods like biking, walking, e-scooter etc): SCALE: 1 = Not important; 10 = Critically important.
Y-Axis “Respondents were asked about the FREQUENCY OF FUTURE USE: If they existed, how often would you use these main multimodal trail connections? SCALE: 1 = Never or Rarely; 2 = Monthly; 3 = Weekly; 4 = Daily
Key things to note:
This visualization helps understand the correlation between importance and frequency of use. Not surprisingly, as importance increases, so does future expected frequency of use (or the reverse).
There is a significant cohort of responses that see trails as important, but only have low to moderate level of use (lower right quadrant). There is also a group of regular future users who see trails as important. There is a smaller group of respondents who don’t see future trails as important, and have no or low level of use.