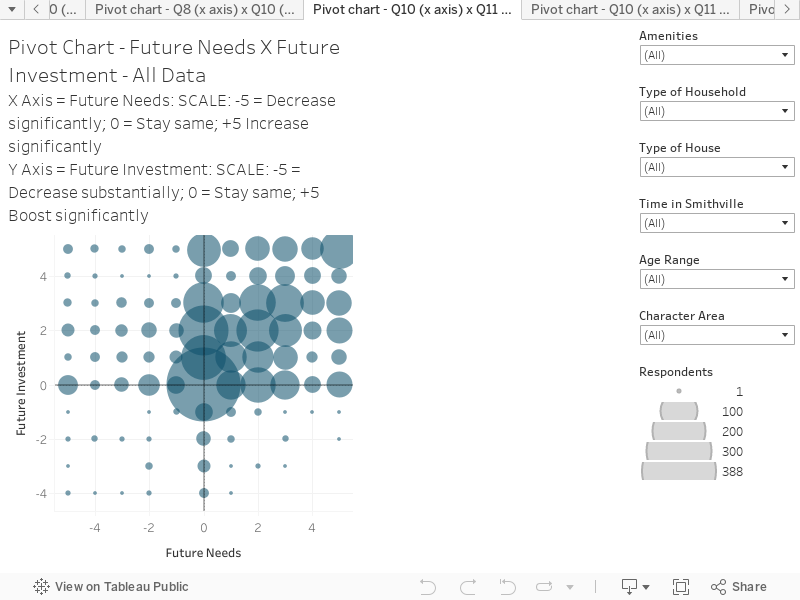
This chart combines responses to two questions (about future need and future investment) to create an interactive scatter plot. You can hover over the chart to reveal more information on each circle.
This chart presents all data.
The chart is structured as follows:
X-Axis is the response to the question “Looking out over next 5-10 years do you anticipate your household’s interest and needs will see an overall increase or decrease in the use of the following broad recreation amenity categories?” SCALE: -5 = Decrease significantly; 0 = Stay same; +5 Increase
Y-Axis is the response to the question “Over the next 5-10 years, how much investment and focus should the City of Smithville apply to each of the following broad categories of parks and recreation infrastructure? (FYI – the current total investment is less than $500,000 / year; but could increase over time with new grants funding). SCALE: -5 Decrease substantially; 0 = Stay same; +5 Boost significantly
Key things to note:
Generally, the responses are cluster in the center and upper right quadrant. This quadrant is where the future needs are forecast to increase, and people feel future investment should increase.
The filters on the right hand side can be used to look at responses by different groups and variation between the different categories of amenities (top filter).