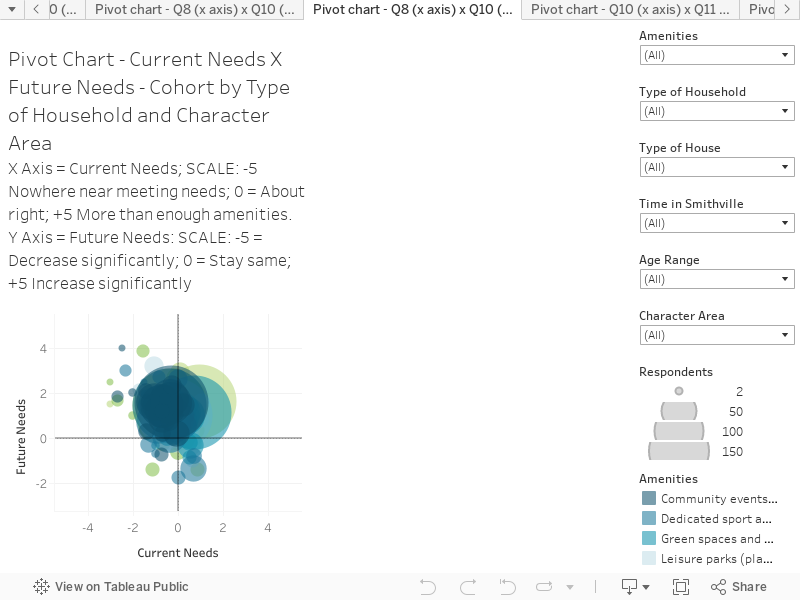
This chart combines responses to two questions (about current and future need) to create an interactive scatter plot. You can hover over the chart to reveal more information on each circle.
This chart presents cohort data. The cohorts are grouped by Type of Household and Character Area.
The chart is structured as follows:
X-Axis is the response to the question “Currently, how well are your household’s needs being meet by the EXISTING following recreation and park amenities?” SCALE: -5 Nowhere near meeting needs; 0 = About right; +5 More than enough amenities.
Y-Axis is the response to the question “Looking out over next 5-10 years do you anticipate your household’s interest and needs will see an overall increase or decrease in the use of the following broad recreation amenity categories?” SCALE: -5 = Decrease significantly; 0 = Stay same; +5 Increase
Key things to note:
The filters on the right hand side can be used to look at responses by different groups and variation between the different categories of amenities (top filter); and then see the cohort groups of Household type and character area.
The filters are additive, so you can apply multiple filters.