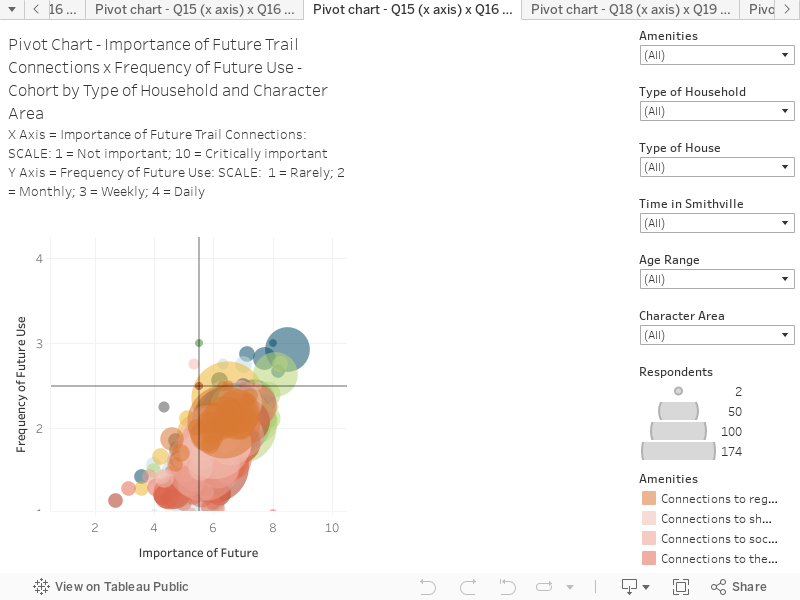
Future Importance x Frequency of Use – Cohort Data
This chart combines responses to two questions (about future importance and frequency of use) to create an interactive scatter plot. You can hover over the chart to reveal more information on each circle.
This chart presents cohort data. The cohorts are grouped by Type of Household and Character Area.
The chart is structured as follows:
X-Axis is the response to the question “Over the next 5-10 years, how important do you think it is for the community to complete the following main multimodal TRAIL connections? (Multimodal in this context means different compatible transport methods like biking, walking, e-scooter etc): SCALE: 1 = Not important; 10 = Critically important.
Y-Axis “Respondents were asked about the FREQUENCY OF FUTURE USE: If they existed, how often would you use these main multimodal trail connections? SCALE: 1 = Never or Rarely; 2 = Monthly; 3 = Weekly; 4 = Daily
Key things to note:
This visualization helps understand issues like who is most likely to use which trails, and how frequently. For example, the trails to downtown connections are rated as important and with a regular frequency of use.
People living in the Downtown Community Oasis area see the trails importance and frequency of use as higher than other residential locations.
The filter on the right allow you to highlight various cohorts and trail amenities.