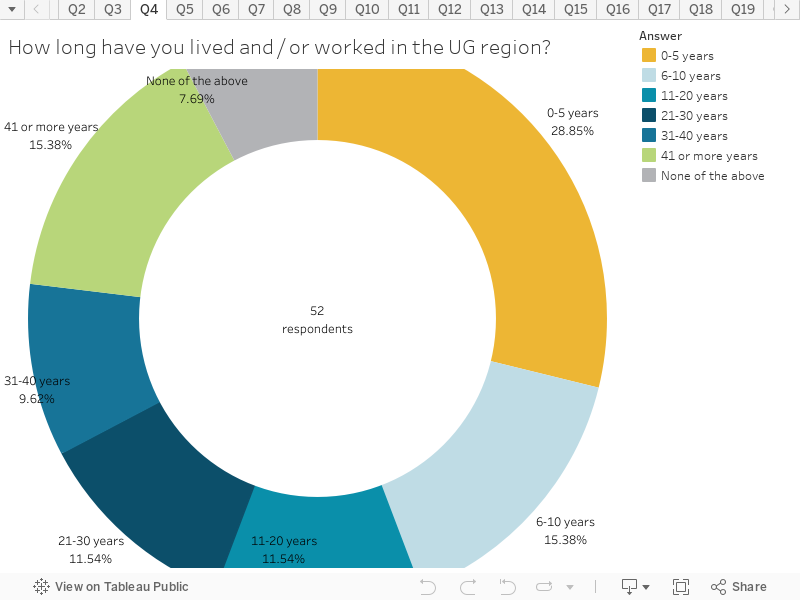
This chart shows how long a respondent has lived and/or worked in the UG region.
Key things to note:
The largest number of survey respondents has lived and/or worked in the UG region for 0-5 years (29%), followed equally by 6-10 years (15%) and 41 or more years (15%).
As reflected in the previous chart, 8% of respondents do not live or work in the UG region.