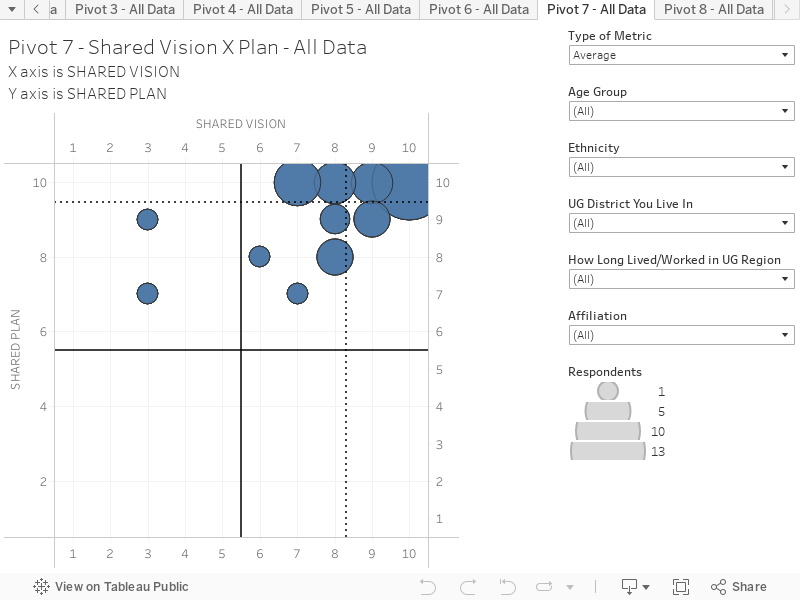
Shared Vision (X-Axis) x Shared Plan (Y-Axis) This chart combines responses to two questions to create an interactive scatter plot. This chart presents the average results based on all respondents. You can hover over the chart to reveal more information on each circle. The chart is structured as follows:
X-Axis is the response to the question “How important do you think it is to have a SHARED VISION for the future of KCK? (i.e., a vision that is shared community-wide) Scale: 1 = Not at all important; 10 = Very important
Y-Axis is the response to the question ”How important do you think it is to have a PLAN for the future of KCK?” (Scale: 1 = Not at all important; 10 = Very important)
Key things to note:
The size of the circle denotes the popularity of the response. This chart shows that respondents felt that having a shared vision and plan were both important to the future of KCK. To some, it was more important to have a plan than to have a shared vision.
The responses can be filtered according to respondent age, ethnicity, UG District you live in, and affiliation.