Attracting Outside Workforce and Home Grown Workforce
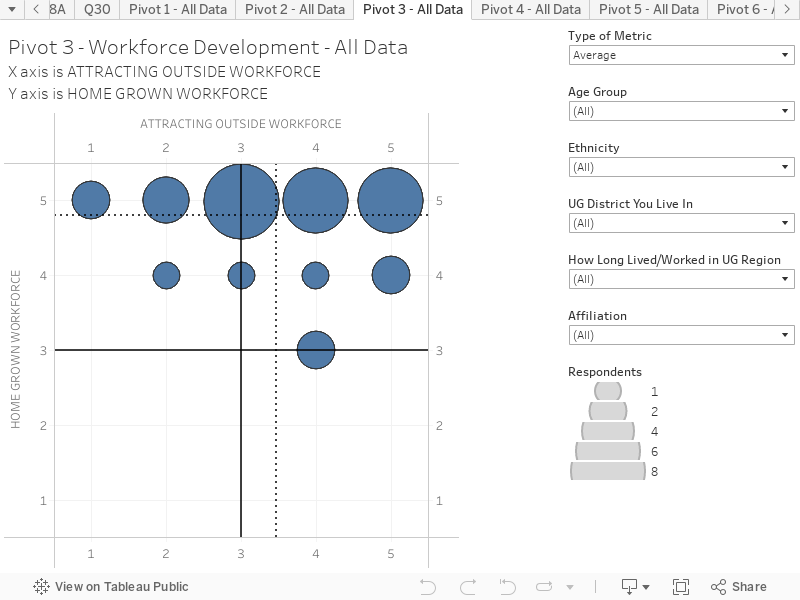
Attracting Outside Workforce (X-Axis) x Home Grown Workforce (Y-Axis) This chart combines responses to two questions to create an interactive scatter plot. This chart presents the average results based on all respondents. You can hover over the chart to reveal more information on each circle. The chart is structured as follows:
X-Axis is the response to the question “When thinking about supporting future workforce development in KCK, how important is it for the UG to concentrate workforce development efforts on attracting and bringing in more skilled labor for businesses from outside of the City? (Scale: 1 = Not at all important; 5 = Very important)
Y-Axis is the response to the question When thinking about supporting future workforce development in KCK, how important is it for the UG to concentrate workforce development efforts on providing more opportunities to local residents such as training and reskilling to support local businesses? (Scale: 1 = Not at all important; 5 = Very important)
Key things to note:
This chart shows that survey respondents consider focusing on workforce development efforts that provide more opportunities to local residents is more important than focusing on attracting workforce from outside of the City.
The responses can be filtered according to respondent age, ethnicity, UG District you live in, and affiliation.