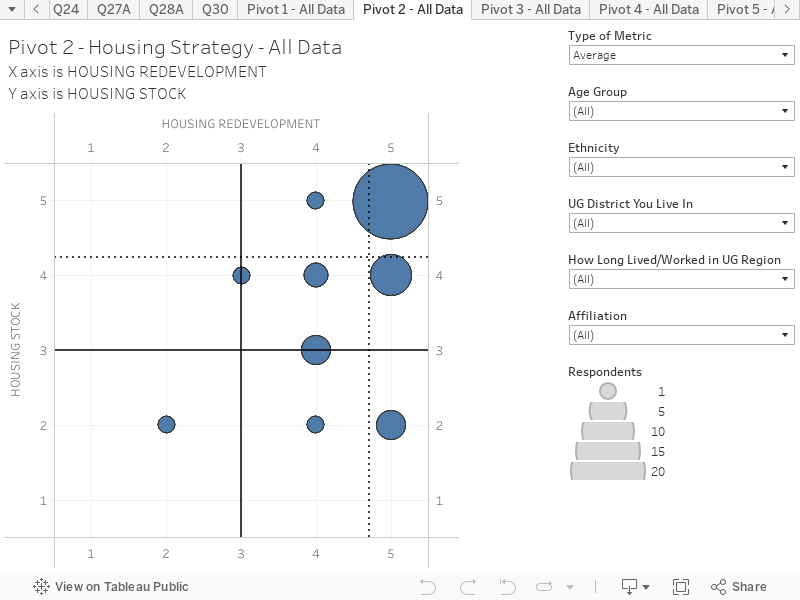
Housing Redevelopment (X-Axis) x Housing Stock (Y-Axis) This chart combines responses to two questions to create an interactive scatter plot. This chart presents the average results based on all respondents. You can hover over the chart to reveal more information on each circle. The chart is structured as follows:
X-Axis is the response to the question “Blight, aging infrastructure, and gentrification are among the many issues that impact urban core areas. How important is it for the UG to focus housing strategy in KCK on redeveloping and improving current housing stock? “(Scale: 1 = Not at all important; 5 = Very important)
Y-Axis is the response to the question Housing quality, availability, and affordability are prevalent issues in KCK and across the country. How important is it for the UG to focus housing strategy on building more housing stock in KCK?” (Scale: 1 = Not at all important; 5 = Very important)
Key things to note:
The size of the circle denotes the popularity of the response. Redeveloping, improving current housing, and building more housing stock are all important to survey respondents. It should be noted that this single topic is considered by many survey respondents to be the most critical topic to be addressed over the next 5 years.
The responses can be filtered according to respondent age, ethnicity, UG District you live in, and affiliation.