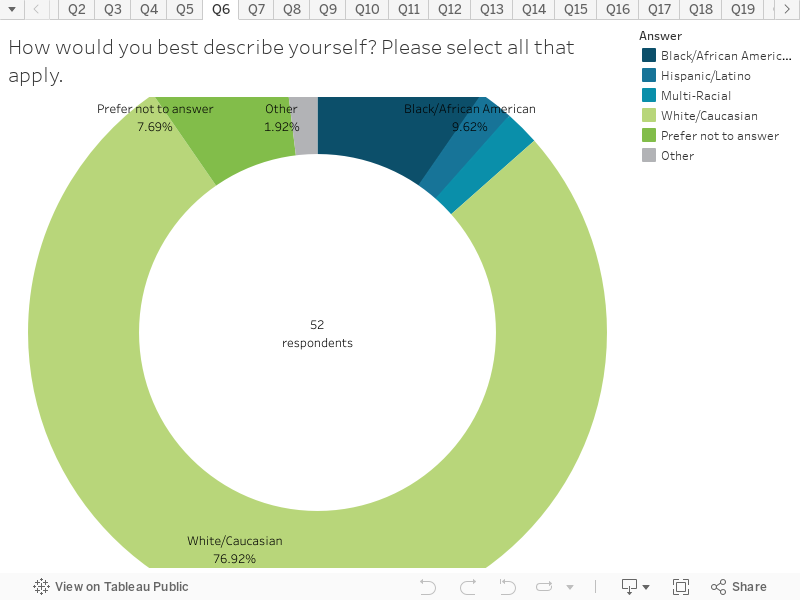
This chart shows how survey respondents best describe themselves.
Key things to note:
The majority of survey respondents described themselves as White/Caucasian (77%), followed by Black/African American (10%), Hispanic/Latino (2%) and Other (2%).
8% of survey respondents preferred not to answer the question.