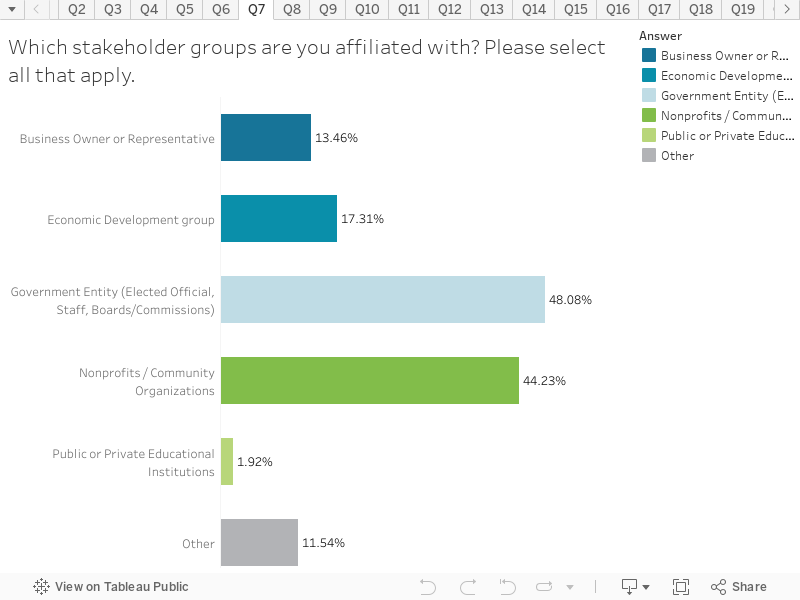
This chart shows the stakeholder groups which best describes the survey respondent’s affiliations.
Key things to note:
The stakeholder groups most represented in the survey results were government entities (Elected Officials, Staff, Boards/Commissions – 48%), and nonprofit organizations (44%), followed by economic groups (17%) and Business Owners or representatives (13%).
Public or private educational institutions represented 2% of the survey respondents and 11% of the respondents listed ‘Other’ as an affiliation.