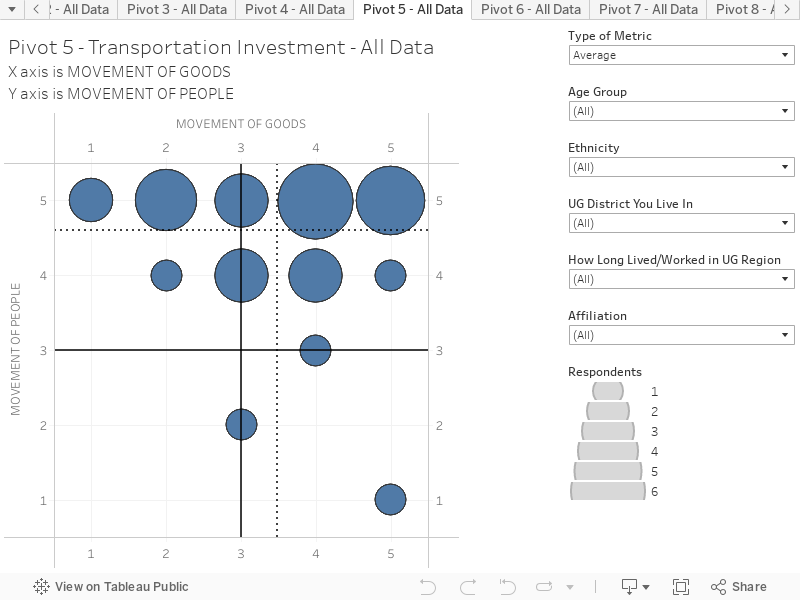
Movement of Goods (X-Axis) x Movement of People (Y-Axis) This chart combines responses to two questions to create an interactive scatter plot. This chart presents the average results based on all respondents. You can hover over the chart to reveal more information on each circle. The chart is structured as follows:
X-Axis is the response to the question “KCK’s economy features industrial and distribution uses. How important do you think it is for the UG to focus transportation investment on trucking and distribution to support prosperity in KCK, including industrial growth?” (Scale: 1 = Not at all important; 5 = Very important)
Y-Axis is the response to the question” Travel to the workplace is a basic necessity for anyone who works outside the home. How important do you think it is for the UG to focus transportation investment on the movement of people (workforce transportation) to support prosperity in KCK?” (Scale: 1 = Not at all important; 5 = Very important)
Key things to note:
This chart shows that where survey respondents consider both types of investment are important, movement of people/workforce is more important for UG transportation investment.
The responses can be filtered according to respondent age, ethnicity, UG District you live in, and affiliation.