Facebook-f
Twitter
Youtube
Home
About
Overview
Project Schedule
Project Team
Surveys
KCK Vision Summit Stakeholder Survey
Data Visualization
Profiling Charts
Respondent Age
UG District
Years lived and/or worked in the UG Region
Zip Code
Respondent Ethnicity
Stakeholder Group Affiliation
SWOT Analysis
KCK’s Strengths or Competitive Advantages
KCK’s Weaknesses
Biggest Opportunities Facing KCK in the Next 25 Years
Biggest Threats or Challenges Facing KCK in the Next 25 Years
Interactive Charts
Distributing Benefit and Growing the Economy
Housing Redevelopment and Housing Stock
Attracting Outside Workforce and Home Grown Workforce
Maintain Focus on Industry and Diversify Business Attraction
Movement of Goods and People
Urban Revitalization and Legacy Urban Center
Shared Vision and Plan
Appetite for Change and Ability to Change
Open Ended Questions
Economic Development Approach – Distributing Benefit
Economic Development Approach – Growing the Economy
Housing Strategy – Housing Redevelopment
Housing Strategy – Housing Stock
Workforce Development – Attracting Outside Workforce
Workforce Development – Home Grown Workforce
Industrial Growth – Maintain Focus on Industry
Industrial Growth – Diversify Business Attraction
Transportation Investment – Movement of Goods
Transportation Investment – Movement of People
Future Positioning of Kansas City, Kansas – Urban Revitalization
Future Positioning of Kansas City, Kansas – Legacy Urban Center
Summits
Vision Summit
Agenda
Slide Decks
Vision Summit
State of the Economy
GoDotte Summary
Housing Summary
Scenario Matrix
Neighborhood Summit
Slide Deck
Community Prosperity Summit
Slide Deck
Resources
Reports
Economic Development Strategic Plan Report
Market Analysis Report
UG Vision Summit Report
Benchmark Report
Unified Gov. Plans
Strategic Mobility Plan
Armourdale Area Master Plan
Central Area Master Plan
Heritage Trail Final Plan
2022 Community Survey
Contact Us
Menu
Home
About
Overview
Project Schedule
Project Team
Surveys
KCK Vision Summit Stakeholder Survey
Data Visualization
Profiling Charts
Respondent Age
UG District
Years lived and/or worked in the UG Region
Zip Code
Respondent Ethnicity
Stakeholder Group Affiliation
SWOT Analysis
KCK’s Strengths or Competitive Advantages
KCK’s Weaknesses
Biggest Opportunities Facing KCK in the Next 25 Years
Biggest Threats or Challenges Facing KCK in the Next 25 Years
Interactive Charts
Distributing Benefit and Growing the Economy
Housing Redevelopment and Housing Stock
Attracting Outside Workforce and Home Grown Workforce
Maintain Focus on Industry and Diversify Business Attraction
Movement of Goods and People
Urban Revitalization and Legacy Urban Center
Shared Vision and Plan
Appetite for Change and Ability to Change
Open Ended Questions
Economic Development Approach – Distributing Benefit
Economic Development Approach – Growing the Economy
Housing Strategy – Housing Redevelopment
Housing Strategy – Housing Stock
Workforce Development – Attracting Outside Workforce
Workforce Development – Home Grown Workforce
Industrial Growth – Maintain Focus on Industry
Industrial Growth – Diversify Business Attraction
Transportation Investment – Movement of Goods
Transportation Investment – Movement of People
Future Positioning of Kansas City, Kansas – Urban Revitalization
Future Positioning of Kansas City, Kansas – Legacy Urban Center
Summits
Vision Summit
Agenda
Slide Decks
Vision Summit
State of the Economy
GoDotte Summary
Housing Summary
Scenario Matrix
Neighborhood Summit
Slide Deck
Community Prosperity Summit
Slide Deck
Resources
Reports
Economic Development Strategic Plan Report
Market Analysis Report
UG Vision Summit Report
Benchmark Report
Unified Gov. Plans
Strategic Mobility Plan
Armourdale Area Master Plan
Central Area Master Plan
Heritage Trail Final Plan
2022 Community Survey
Contact Us
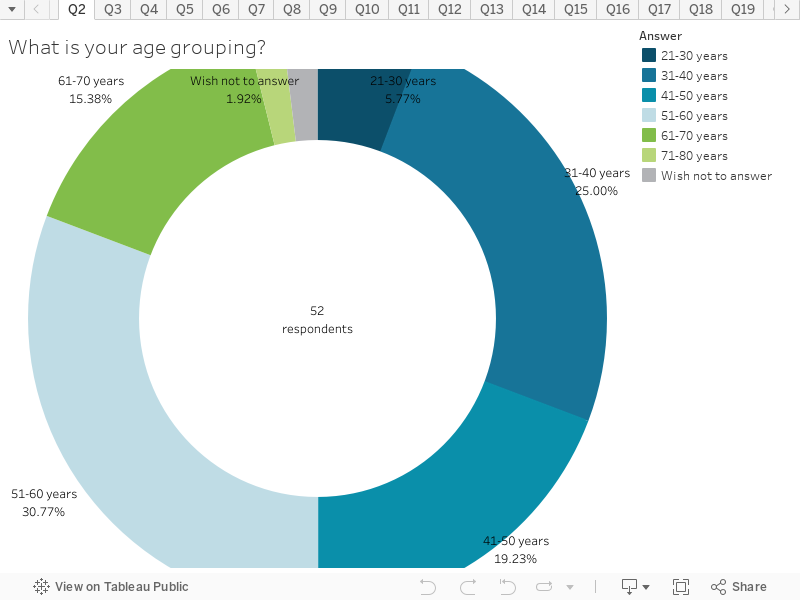
Respondent Age
This chart shows the age groupings of the people who completed the survey.
Key things to note:
The largest group of respondents was between the ages of 51-60 years, followed by 31-40 years, and 41-50 years.
The least representative age grouping are between the ages of 21-30 years.
Next >>