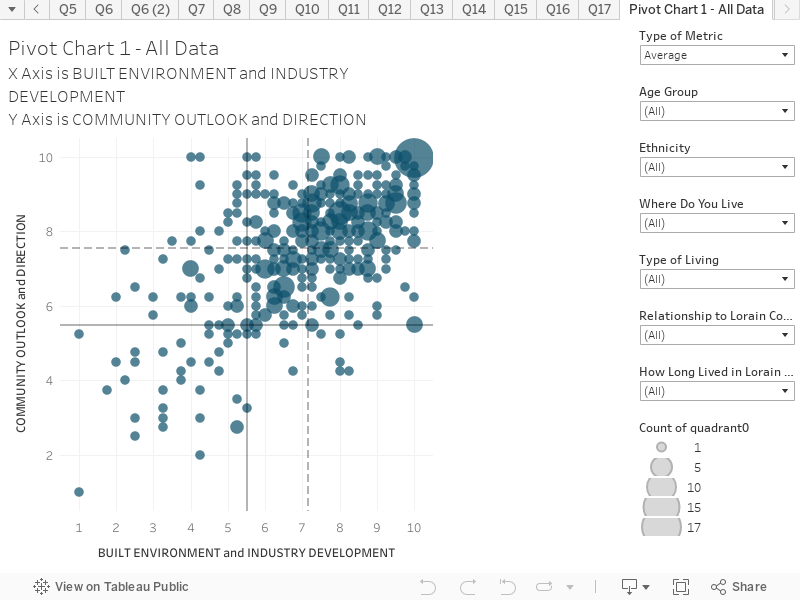
This chart combines the responses from the six Key Future Shaping Themes charts. This chart presents the results based on all respondents. You can hover over the chart to reveal more information on each circle. The chart is structured as follows:
X-Axis is the response to the questions relating to Built Environment and Industry Development
Y-Axis is the response to the questions relating to Community Outlook and Direction
Key things to note:
This chart can be filtered to allow you to explore responses by different cohorts.