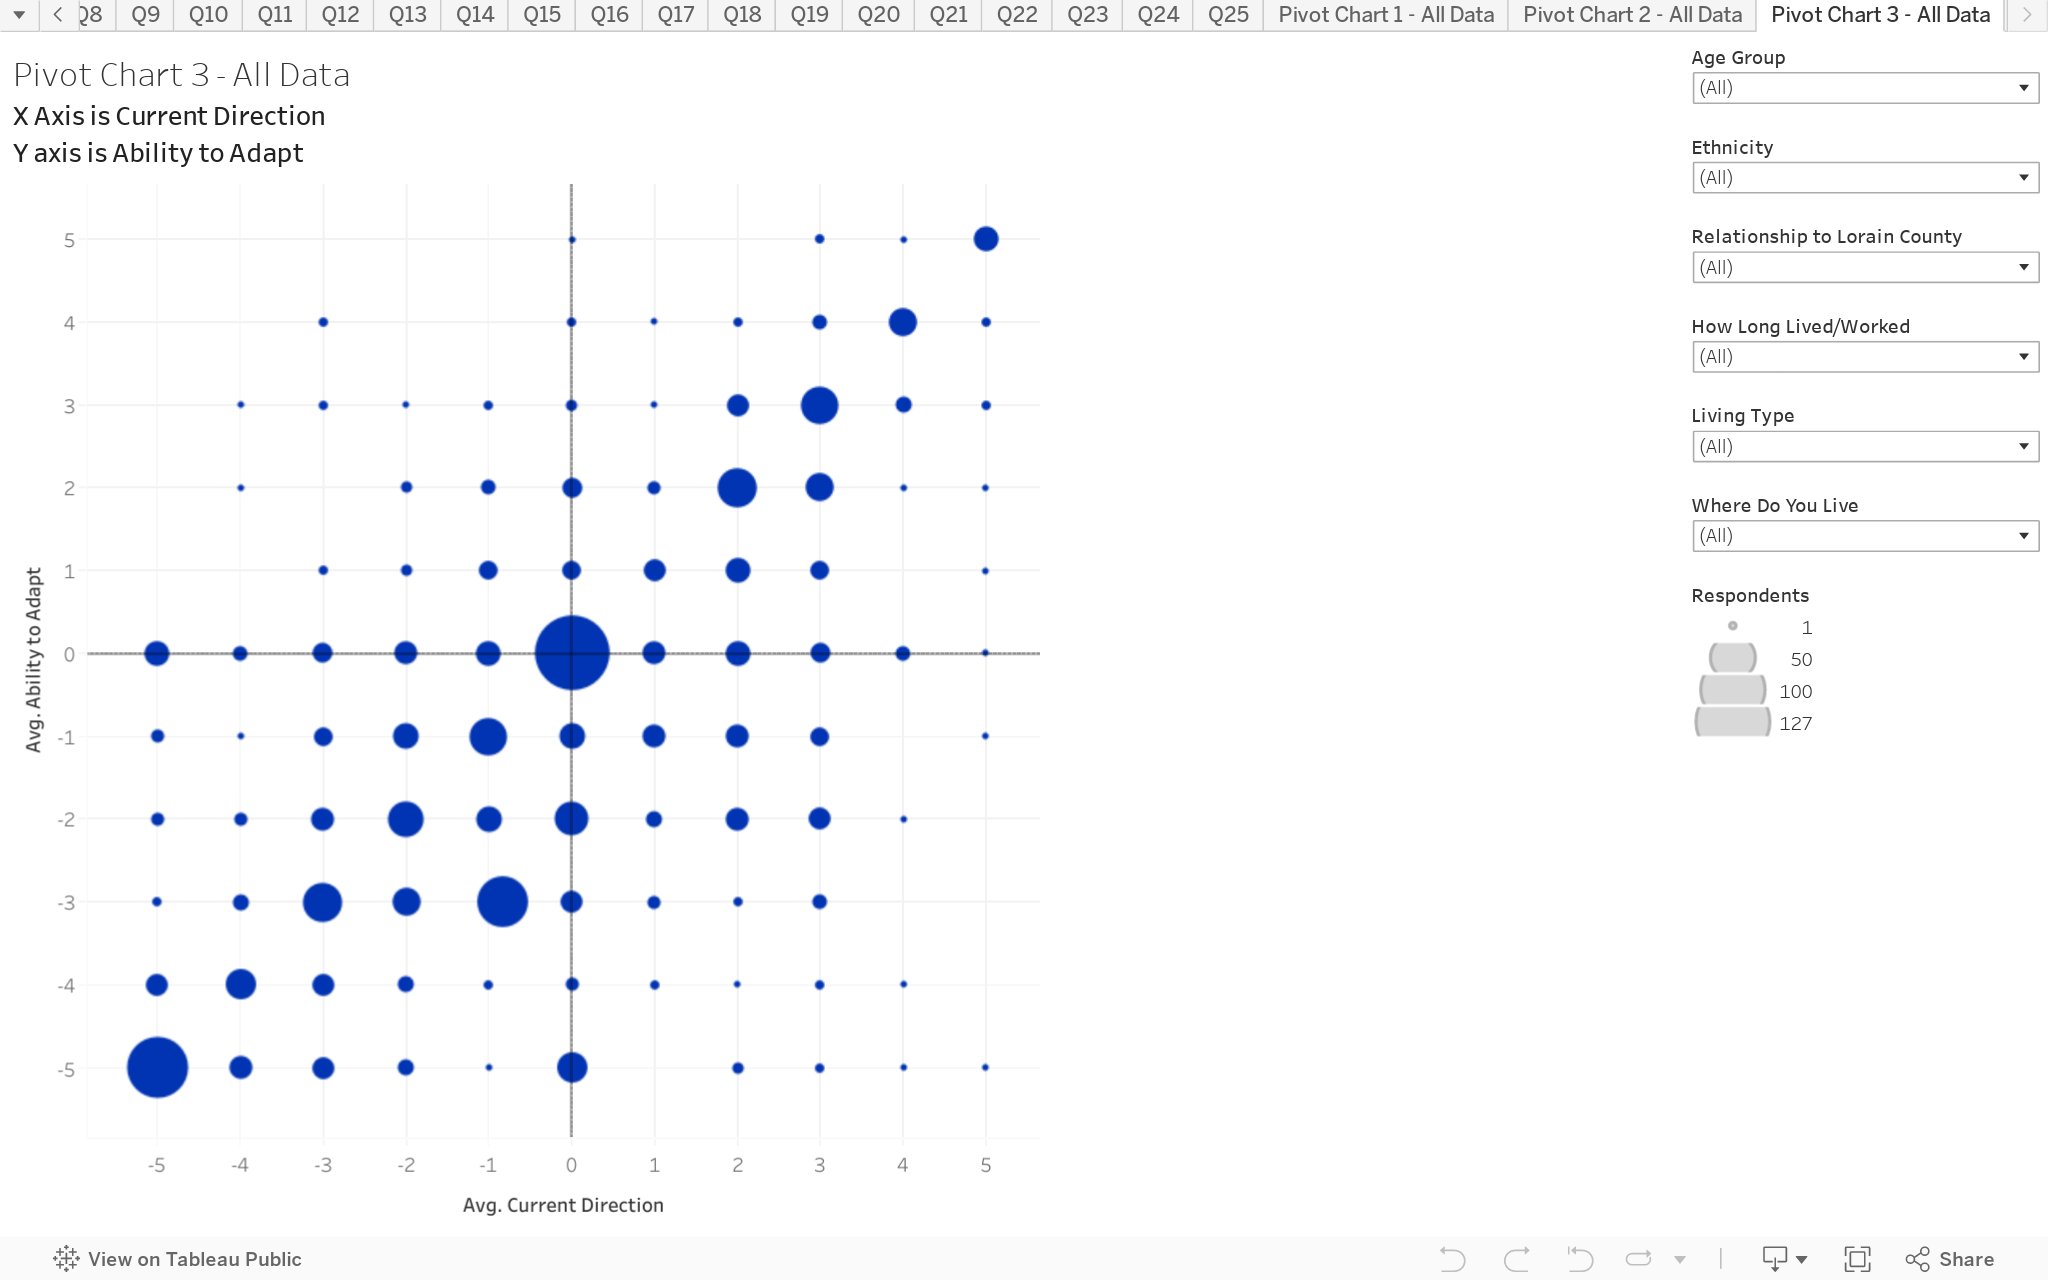
Current Direction (X Axis) x Ability to Adapt (Y Axis)
This chart combines responses to two questions to create an interactive scatter plot. This chart presents the results based on all respondents. You can hover over the chart to reveal more information on each circle.
The chart is structured as follows:
X-Axis is the response to the question ‘How satisfied or concerned are you about the way Lorain County is changing and the overall current direction of Lorain County?’. The scale is -5= Very concerned; 0=Neutral; +5 = Very satisfied.
Y-Axis is the response to the question ‘How satisfied or concerned are you about the ability of the Lorain County organization to adapt to current and future changes? The scale is -5= Very concerned; 0=Neutral; +5 = Very satisfied.
Key things to note:
This question can be filtered to allow you to explore responses by different cohorts.