This chart combines responses to two questions to create an interactive scatter plot. This chart presents the results based on all respondents. You can hover over the chart to reveal more information on each circle.
The chart is structured as follows:
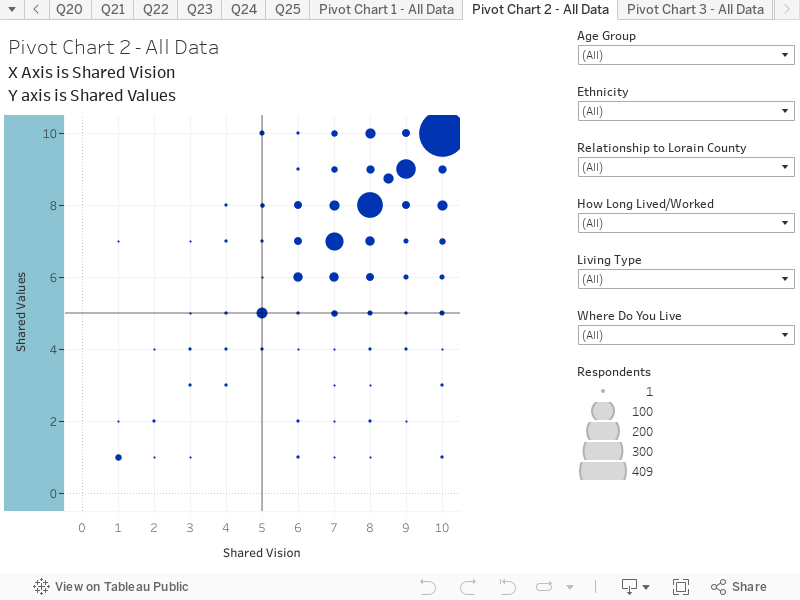
X-Axis is the response to the question ‘How important is it to have a shared vision for the future of Lorain County?’ The scale is 1= Not important; 10 = Highly important
Y-Axis is the response to the question ‘How important do you think it is to identify shared values for Lorain County?’ The scale is 1= Not important; 10 = Highly important
Key things to note:
This question can be filtered to allow you to explore responses by different cohorts.