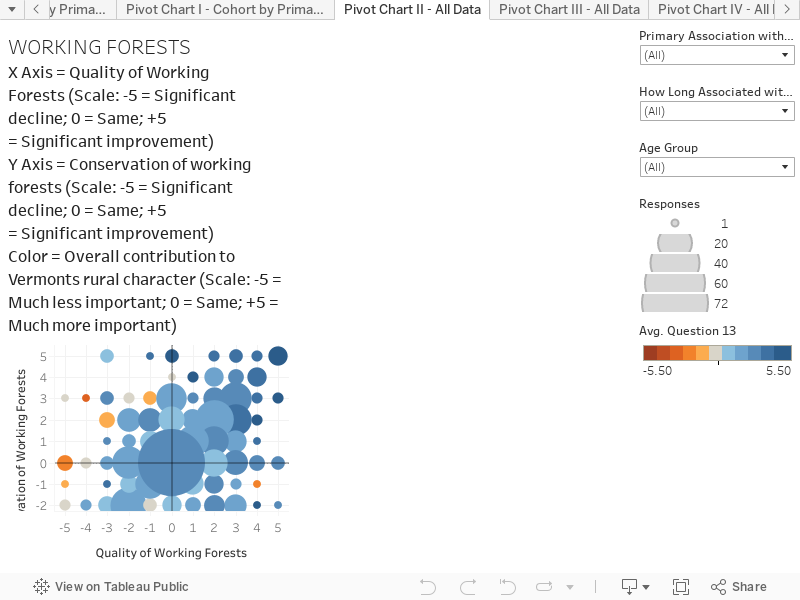
This chart combines responses to two questions to create an interactive scatter plot. This chart presents the results based on all respondents. You can hover over the chart to reveal more information on each circle. The chart is structured as follows:
X-Axis is the response to the question “From a forest products perspective, do you think the quality of the working forests in Vermont will improve or decline over the next decade?”. The scale is: -5 = Significant decline; 0 = Same; 5 = Significant improvement
Y-Axis is the response to the question “Over the next decade, do you see the conservation of working forests in Vermont improving of declining?”. The scale is: -5 = Significant decline; 0 = Same; 5 = Significant improvement
Color is a scale in response to the question “Over the next decade, do you see Vermont’s working forests becoming more, or less, important, in terms of enhancing and preserving the rural character and identity of Vermont?” The scale is: -5 = Much less important; 0 = Same; +5 = Much more important
Key things to note:
This scatter plot shows a wide range of responses on the question of the future of the quality of working forests, and the conservation of working forests.
Overall, these is a strong view that working forests will become increasingly important in enhancing and preserving the rural character and identity of Vermont.