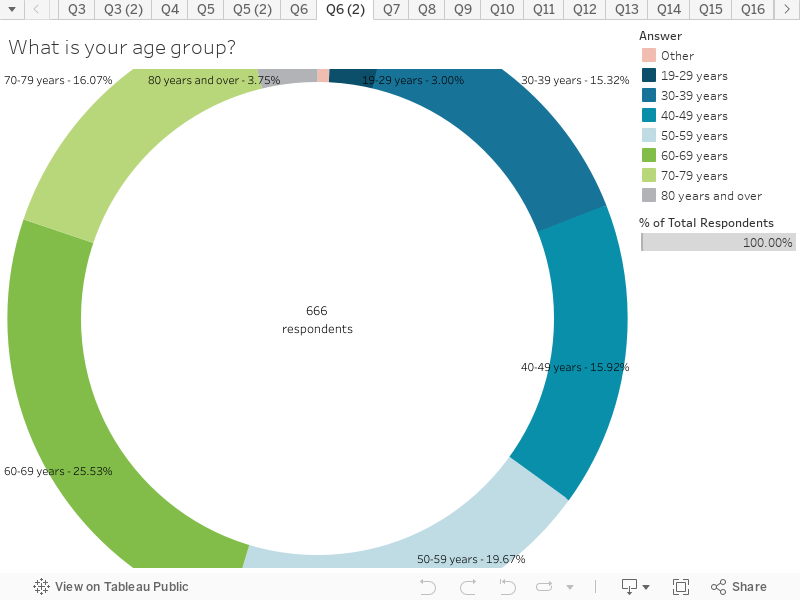
This chart shows the age groupings of the people who completed the survey.
Key things to note:
The majority of survey respondents are between the ages of 60 – 69 years, followed by those between the ages of 50-59 years. This shows an aging workforce.
The least representative age grouping are those between the ages of 19 – 29 years.