This survey gathered important input on the concept of the least desired, expected, and preferred futures for the Vermont forest economy. Survey participants were asked to identify the three types of future on the modified scenario matrix. This layers a 10 x 10 grid over the scenario matrix, creating 100 different possible versions of the future, all subtly different. Participants were able to locate their different futures based on the two main continuums and understanding the description of the broad scenarios. This approach helps identify the perception about the current trajectory, and importantly helps define the preferred future. The preferred future represents a broad vision for the future. These futures were described as:
Least Desired Future – The Least Desired Future is the future that you think will be most undesirable (or least optimal or least desired) future in 2035.
Expected Future – The Expected Future is the future you expect most likely to eventuate by 2035, if existing trends and trajectory persists.
Preferred Future – The Preferred Future is the future you think is optimal and creates the best outcome for Vermont forest economy in 2035.
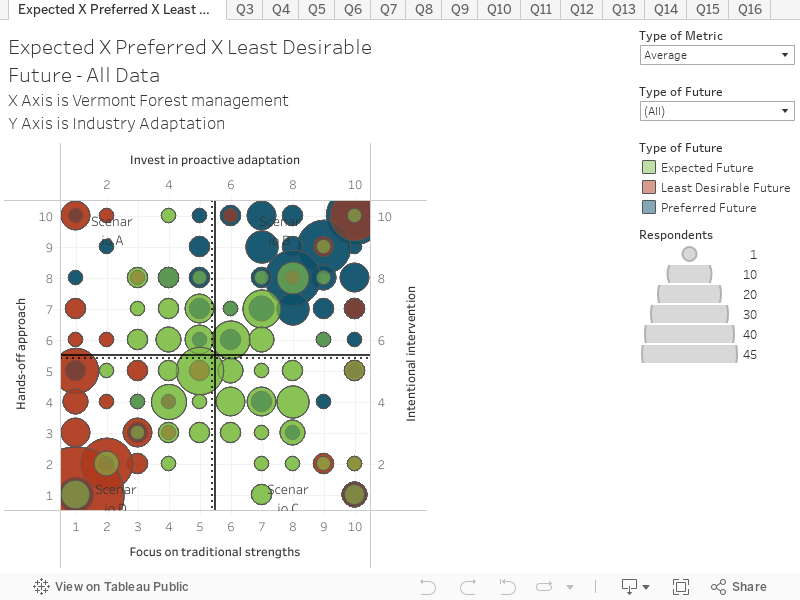
USING THE CHART:
You can select the different futures data on the menu on the right-hand side – under the “Type of Future” filter.
The dotted line will show either median or average points – see the top filter “type of metric”
Least Desired Future – The data of the least desired future shows a strong concentration along the bottom-left quadrant of Scenario D. There are also responses in the extremities of the other three scenario, which are the amplified versions of these future scenarios.
Expected Future – Survey responses show a general pattern of responses that are clustered around the center of the overall scenario matrix. There are some significant outliers to this cluster, but overall, the responses are aggregated reasonably tightly in the central area.
Preferred Future – Survey participants expressed strong preference for the Preferred Future in the upper right of the scenario matrix. This future combines strong investment in proactive adaptation and intentional intervention at both an investment and policy level. There are some outliers to this cluster, including several responses in the lower left. However, the ‘point of consensus’ in the scenario B space, and there is a relatively tight concentration of responses. The three largest response locations are in the center and very upper right of the scenario B space, which reflects a significant appetite for change.