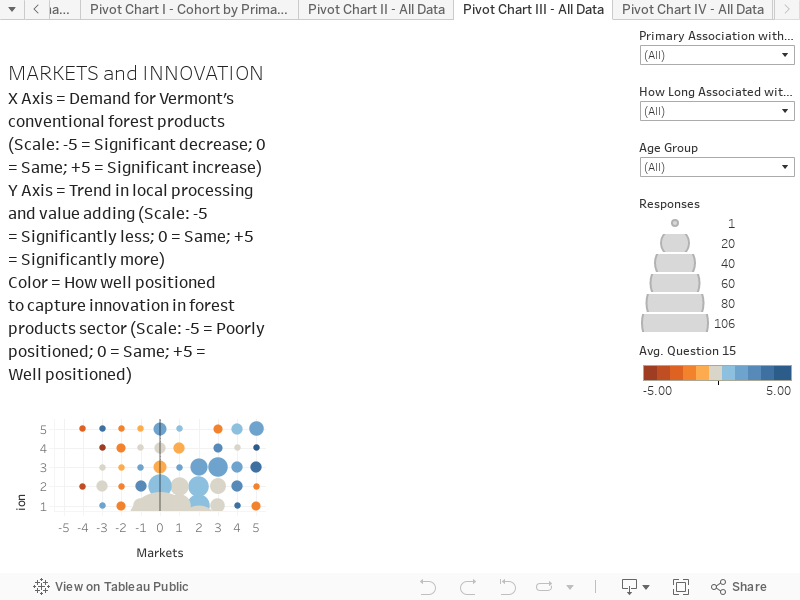
This chart combines responses to two questions to create an interactive scatter plot. This chart presents the results based on all respondents. You can hover over the chart to reveal more information on each circle. The chart is structured as follows:
X-Axis is the response to the question “Over the next decade, do you see demand for Vermont’s conventional forest products (logs, pulpwood, fuelwood) increasing or decreasing?”. The scale is -5 = Significant decrease; 0 = Same; 5 = Significant increase
Y-Axis is the response to the question “Over the next decade, do you see Vermont having more, or less, local processing and manufacture of solid and composite wood products like those used for construction and home furnishings? Scale: -5 = Significantly less; 0 = Same; +5 = Significantly more
Color is in response to the question: How well positioned is Vermont to develop, capture and apply innovation within the forest products sector?”. The scale is -5 = Poorly positioned; 0 = Neutral; 5 = Well positioned