Future of Forest Products Sector & Vermont Forest Economy
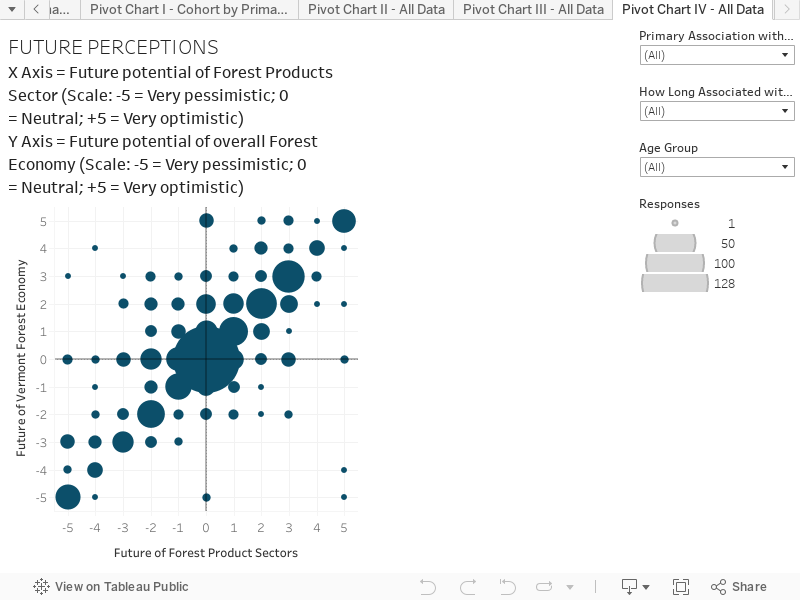
This chart combines responses to two questions to create an interactive scatter plot. This chart presents the results based on all respondents. You can hover over the chart to reveal more information on each circle. The chart is structured as follows:
X-Axis is the response to the question “Looking out over the next decade, are you mostly optimistic or pessimistic about the future potential of the Vermont forest products sector?”. The scale is -5 = Very pessimistic; 0 = Neutral; 5 = Very optimistic
Y-Axis is the response to the question “Looking out over the next decade, are you mostly optimistic or pessimistic about the future potential of the overall Vermont forest economy?”. The scale is -5 = Very pessimistic; 0 = Neutral; 5 = Very optimistic
Key things to note:
Overall, there is a wide range of responses, with the majority clustered around the middle which was the ‘neutral’ point on the scale.
This likely reflects that people do not have a clear view of the future and the likely outcomes, or that the future is viewed with mixed feelings.