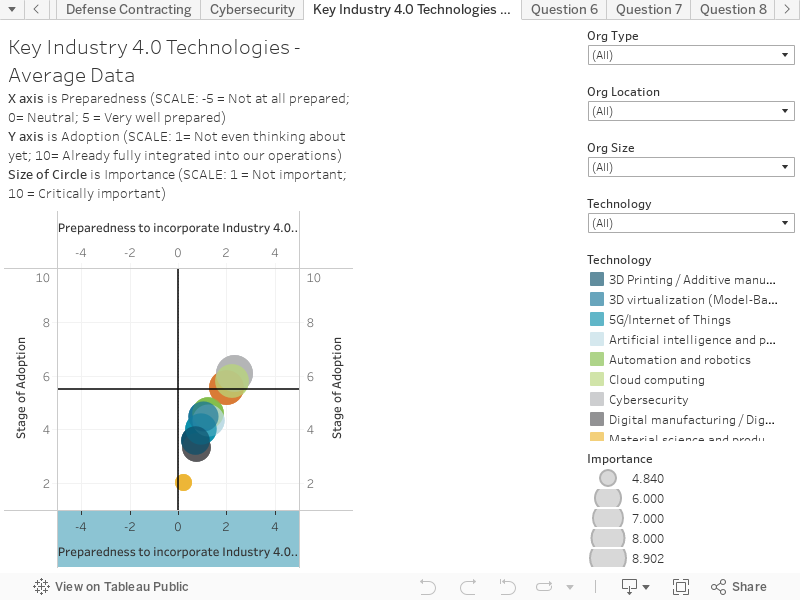
This chart combines responses to three questions to create an interactive scatter plot. This visualization shows response data as it relates to all 10 Industry 4.0 technologies. This chart presents the average results based on all respondents. You can hover over the chart to reveal more information on each circle.
The chart is structured as follows:
X-Axis is the response to the question “Preparedness: How prepared is your organization to incorporate the following technological drivers?”. The scale is: -5 = Not at all prepared, 0 = Neutral; 10 = Very well prepared
Y-Axis is the response to the question “Adoption: What stage are you at, in terms of applying the following industry 4.0 technologies”. The scale is: 1 = Not even thinking about yet; 10 = Already fully integrated into our operations
Key things to note:
There were two clusters that were presented clearly on the chart.
The Industry 4.0 technologies that the region was most prepared to incorporate and at an earlier stage ready to adopt/already adopting were Cybersecurity, Cloud Computing and Software and Data Engineering.
Material Science and Product Innovation was the technology that the region was least prepared to adopt.
Overall the chart shows that there is a low rate of adoption and preparedness of all of the Industry 4.0 technologies.
MORE INFORMATION
For more information about The Middle Georgia Innovation Project, please contact:
Angie Gheesling, Executive Director Development Authority of Houston County 200 Carl Vinson Parkway Warner Robins, GA 31088 Phone: (478) 923-5470 gheesling@houstoncountyga.net