Importance to future of Minnesota, Upper Midwest and Nationally
This chart combines responses to two questions to create an interactive scatter plot. This chart presents the results based on all respondents. You can hover over the chart to reveal more information on each circle. The chart is structured as follows:
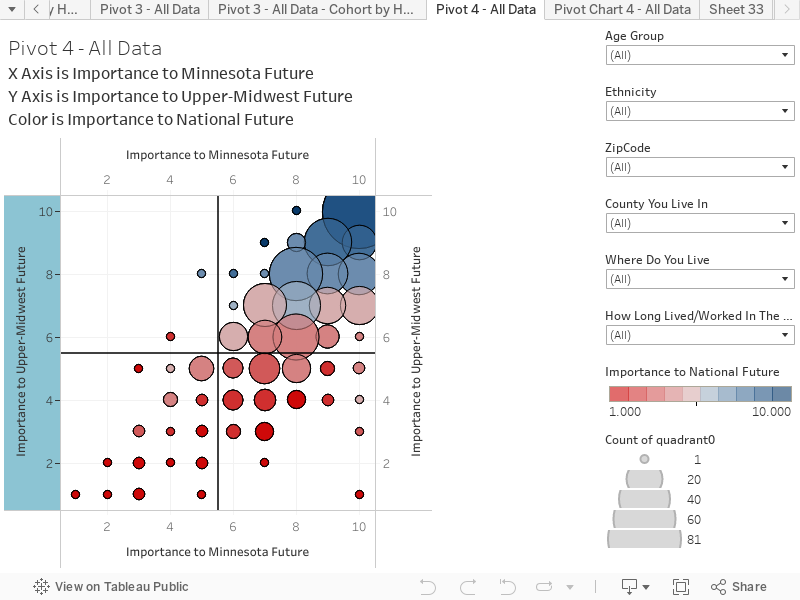
X-Axis is the response to the question Over the next 10-20 years, how important and relevant do you think this region could be to the future of MINNESOTA? SCALE: 1 = Not important; 10 = Very important
Y-Axis is the response to the question “Over the next 10-20 years, how important and relevant do you think this region could be to the future of the UPPER-MIDWEST?” SCALE: 1 = Not important; 10 = Very important
Color is in response to the question “Over the next 10-20 years, how important and relevant do you think this region could be to the future NATIONALLY and even GLOBALLY?” SCALE: 1 = Not important; 10 = Very important
Key things to note:
Overall, most people are in the upper right, where there is a perception that the region is important to the future of Minnesota and the Upper Midwest.
However, there are significant number of responses where people feel the region is not that important to the future of the Upper Midwest, or Nationally / Globally.