Importance of a Shared Vision, Values, and Regional Plan
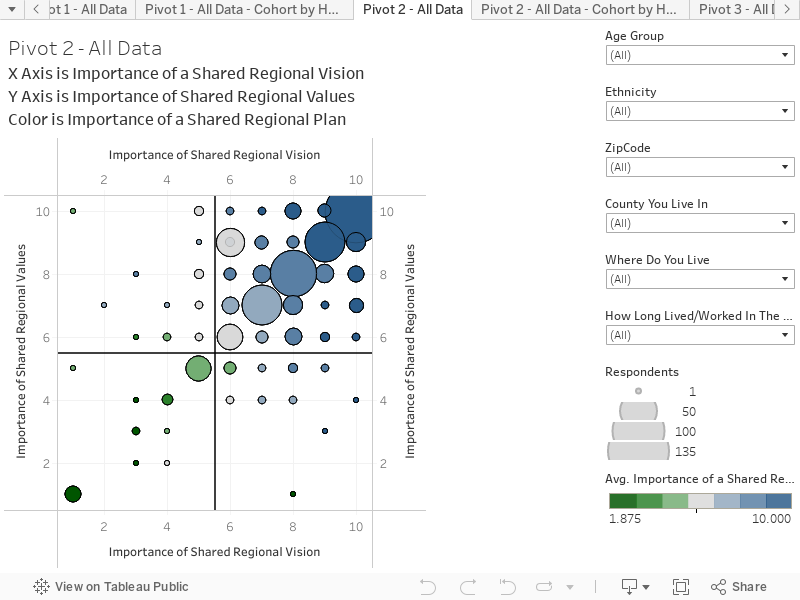
This chart combines responses to two questions to create an interactive scatter plot. This chart presents the results based on all respondents. You can hover over the chart to reveal more information on each circle. The chart is structured as follows:
X-Axis is the response to the question “How important is it to have a SHARED REGIONAL VISION for the future of this Greater Mankato region?”. The scale is 1 = Not important; 10 = Highly important
Y-Axis is the response to the question “How important do you think it is to identify SHARED REGIONAL VALUES for this Greater Mankato region?”. The scale is 1 = Not important; 10 = Highly important
Color is in response to the question “How important do you think it is to have a SHARED REGIONAL PLAN that maps out a future for this Greater Mankato region?” SCALE: 1 = Not important; 10 = Highly important
Key things to note:
The data shows a very strong response to the idea of identifying shared vision, values and a regional plan.
This data is good validation for the timing the Greater Mankato 2040 initiative, and the approach of creating an inclusive and stakeholder driven regional planning process.