Facebook-f
Twitter
Youtube
Home
About
Our Approach
Littleton Project Schedule
Littleton Project Team
Survey Results
Student Survey
Profiling Charts
Respondent Age
Years lived and/or attended school in Littleton
Respondent Ethnicity
School currently attending
Big Picture Questions – You and the Future
Optimism for the future
Optimism for your future career prospects
Excitement for the future
Concerns for the future
Preparedness for the future
Future intelligence
Size of trends impact
Positive/negative impact of trends
Need to know to be prepared for the future
Littleton and Your Future
Littleton as a place to live and/or attend school
Like most about Littleton
Dislike about Littleton
Best thing about Littleton
Staying in Littleton after high school/college
Things impacting your decision to stay or leave Littleton
Making Littleton a better place for young people
Your Future Career Questions
Interest in Littleton as future option to live and work
Pursuing higher education after high school/college
Interest in topic areas for future study or career
Type of career or employment
Influences on current thinking about the future
Companies/organizations in Littleton or Denver you would love to work with or learn more about
Any additional comments?
Stakeholder Survey
Profiling Charts
Respondent Age
Years lived and/or worked in Littleton
Zip Code
Respondent Ethnicity
Stakeholder Group Affiliation
Future Perspective Questions
Placemaking and Neighborhood Development
Connectivity – Downtown to South Park Areas
Gateway Development
Regional Leadership
Safety and Security
Housing Availability and Affordability
Preserving Current Mid-Century Heritage and Design
Mid-Mod Mile Development
Workforce Attraction
Workforce Development
Business Development – Attraction New
Business Development – Growing Local
Single most important topic to focus on over next 5 years
SWOT Analysis
Littleton’s Strengths or Competitive Advantages
Littleton’s Weaknesses
Biggest Opportunities Facing Littleton
Biggest Threats or Challenges Facing Littleton
Vision and Plan
Importance of a Shared Vision
Importance of a Plan for Economic Development
Interactive Charts
Mid-Century Heritage Economic Development Approach
Workforce Attraction and Development
Business Development – Attraction New and Growing Local
Shared Vision and Economic Development Plan
Additional Comments
Engagement
Think-Tank
Overview
Future Scenario Summary
Agenda
English
Española
Slide Deck Part 1
Slide Deck Part 2
Think-Tank Report
Focus Groups
Overview
Feedback Session
Overview
Reports
CEDS Final Report
Storymap
Overview
Littleton CEDS Storymap
Think-Tank Report
Economic Benchmark Report
Resources
Downtown Littleton Plan of Development
Envision Littleton
2022 Business Survey Results
Newsletters
Newsletter 1: Oct. 2, 2023
Newsletter 2: Nov. 16, 2023
Newsletter 3: Feb. 19, 2024
Newsletter 4: Mar. 8, 2024
Contact Us
Menu
Home
About
Our Approach
Littleton Project Schedule
Littleton Project Team
Survey Results
Student Survey
Profiling Charts
Respondent Age
Years lived and/or attended school in Littleton
Respondent Ethnicity
School currently attending
Big Picture Questions – You and the Future
Optimism for the future
Optimism for your future career prospects
Excitement for the future
Concerns for the future
Preparedness for the future
Future intelligence
Size of trends impact
Positive/negative impact of trends
Need to know to be prepared for the future
Littleton and Your Future
Littleton as a place to live and/or attend school
Like most about Littleton
Dislike about Littleton
Best thing about Littleton
Staying in Littleton after high school/college
Things impacting your decision to stay or leave Littleton
Making Littleton a better place for young people
Your Future Career Questions
Interest in Littleton as future option to live and work
Pursuing higher education after high school/college
Interest in topic areas for future study or career
Type of career or employment
Influences on current thinking about the future
Companies/organizations in Littleton or Denver you would love to work with or learn more about
Any additional comments?
Stakeholder Survey
Profiling Charts
Respondent Age
Years lived and/or worked in Littleton
Zip Code
Respondent Ethnicity
Stakeholder Group Affiliation
Future Perspective Questions
Placemaking and Neighborhood Development
Connectivity – Downtown to South Park Areas
Gateway Development
Regional Leadership
Safety and Security
Housing Availability and Affordability
Preserving Current Mid-Century Heritage and Design
Mid-Mod Mile Development
Workforce Attraction
Workforce Development
Business Development – Attraction New
Business Development – Growing Local
Single most important topic to focus on over next 5 years
SWOT Analysis
Littleton’s Strengths or Competitive Advantages
Littleton’s Weaknesses
Biggest Opportunities Facing Littleton
Biggest Threats or Challenges Facing Littleton
Vision and Plan
Importance of a Shared Vision
Importance of a Plan for Economic Development
Interactive Charts
Mid-Century Heritage Economic Development Approach
Workforce Attraction and Development
Business Development – Attraction New and Growing Local
Shared Vision and Economic Development Plan
Additional Comments
Engagement
Think-Tank
Overview
Future Scenario Summary
Agenda
English
Española
Slide Deck Part 1
Slide Deck Part 2
Think-Tank Report
Focus Groups
Overview
Feedback Session
Overview
Reports
CEDS Final Report
Storymap
Overview
Littleton CEDS Storymap
Think-Tank Report
Economic Benchmark Report
Resources
Downtown Littleton Plan of Development
Envision Littleton
2022 Business Survey Results
Newsletters
Newsletter 1: Oct. 2, 2023
Newsletter 2: Nov. 16, 2023
Newsletter 3: Feb. 19, 2024
Newsletter 4: Mar. 8, 2024
Contact Us
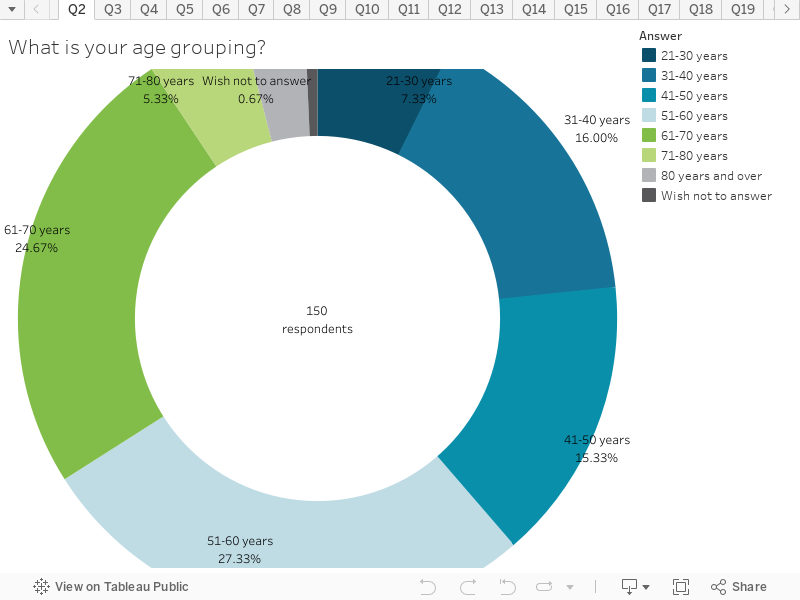
Respondent Age
This chart shows the age groupings of the people who completed the survey.
Key things to note:
The largest group of respondents was between the ages of 51-60 years (27%), followed by 61-70 years (24%), 31-40 years (16%), and 41-50 years (15%).
The least representative age grouping are between the ages of 21-30 years (7%) and 71-80 years (5%).
Next >>