Facebook-f
Twitter
Youtube
Home
5-Acre Study
Overview
Purpose
Timeline
Advisory Group
Surveys
Overview
Phase II Survey Results
Phase I Survey Results
Overview
Profiling Charts
Respondent Age Grouping
Respondent Ethnicity
Respondent Zip Code
Respondent Residency
5-Acre Site
Connection to the Site
Frequency of Visiting the Site
Travelling to the Site
Describing the Site Today
Inclusion of Arts and Culture on the Site
Reasons for Spending Time at the Site
Types of Developments or Improvements at the Site
The Site in 5 Years’ Time
Great Districts or Developments Visited
Further Comments on the Plan
Download Raw Survey Data
Small Area Plan
Overview
Purpose
Timeline
Advisory Group
Surveys
Overview
Phase II Survey Results
Phase I Survey Results
Overview
Profiling Charts
Respondent Age Grouping
Respondent Ethnicity
Respondent Zip Code
Respondent Residency
Small Area Plan
Connection to the Study Area
Time Spent in the Study Area
Travelling to the Study Area
Favorite Things about the Study Area
Satisfaction with the Study Area Today
Main Priorities for the Plan
Mobility Improvements in the Study Area
Mix of Land Uses in the Study Area
Things Changed / Improved in the Study Area
Focus of Attention Within the Study Area
Further Comments on the Plan
Download Raw Survey Data
Los Proyectos
Sobre
Engagement
Overview
Community Meetings
Phase I Community Meeting – July 19, 2023
Phase II Community Meeting – October 18, 2023
Phase III Community Meeting – April 9, 204
Online Engagement
Project Advisory Group
Stakeholder Roundtables
Resources
Bonanza Park Financial History
General Plan
Vision 2020 Portal
Vision 2020 Report
Transportation and Demand Management Plan (2016)
Short Range Transit Plan (2016)
State Road 224 Bus Rapid Transit Locally Preferred Alternative
Park City Forward, Long Range Transportation Plan
2011 Transportation Master Plan
2022 Park City Rail Trail Master Plan
Short Range Transit Plan (2022)
Park City 2021 Housing Needs Assessment
Contact Us
Menu
Home
5-Acre Study
Overview
Purpose
Timeline
Advisory Group
Surveys
Overview
Phase II Survey Results
Phase I Survey Results
Overview
Profiling Charts
Respondent Age Grouping
Respondent Ethnicity
Respondent Zip Code
Respondent Residency
5-Acre Site
Connection to the Site
Frequency of Visiting the Site
Travelling to the Site
Describing the Site Today
Inclusion of Arts and Culture on the Site
Reasons for Spending Time at the Site
Types of Developments or Improvements at the Site
The Site in 5 Years’ Time
Great Districts or Developments Visited
Further Comments on the Plan
Download Raw Survey Data
Small Area Plan
Overview
Purpose
Timeline
Advisory Group
Surveys
Overview
Phase II Survey Results
Phase I Survey Results
Overview
Profiling Charts
Respondent Age Grouping
Respondent Ethnicity
Respondent Zip Code
Respondent Residency
Small Area Plan
Connection to the Study Area
Time Spent in the Study Area
Travelling to the Study Area
Favorite Things about the Study Area
Satisfaction with the Study Area Today
Main Priorities for the Plan
Mobility Improvements in the Study Area
Mix of Land Uses in the Study Area
Things Changed / Improved in the Study Area
Focus of Attention Within the Study Area
Further Comments on the Plan
Download Raw Survey Data
Los Proyectos
Sobre
Engagement
Overview
Community Meetings
Phase I Community Meeting – July 19, 2023
Phase II Community Meeting – October 18, 2023
Phase III Community Meeting – April 9, 204
Online Engagement
Project Advisory Group
Stakeholder Roundtables
Resources
Bonanza Park Financial History
General Plan
Vision 2020 Portal
Vision 2020 Report
Transportation and Demand Management Plan (2016)
Short Range Transit Plan (2016)
State Road 224 Bus Rapid Transit Locally Preferred Alternative
Park City Forward, Long Range Transportation Plan
2011 Transportation Master Plan
2022 Park City Rail Trail Master Plan
Short Range Transit Plan (2022)
Park City 2021 Housing Needs Assessment
Contact Us
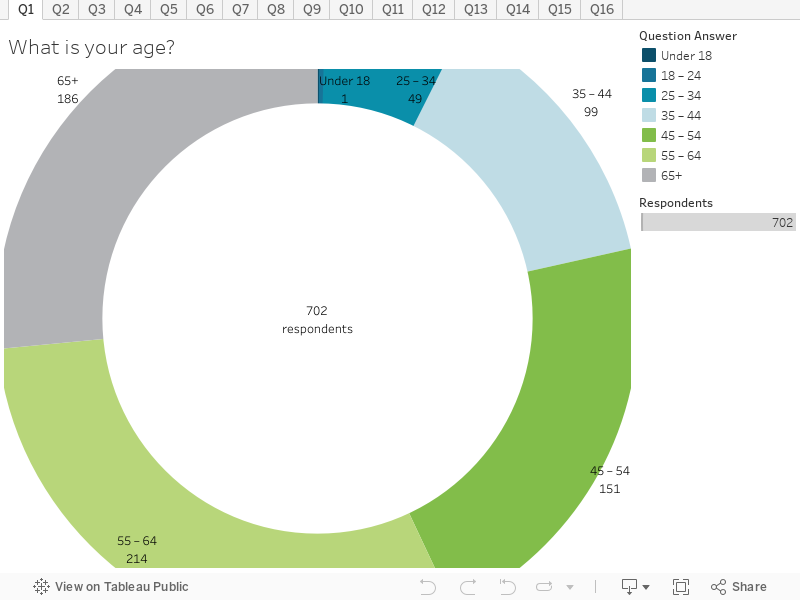
Respondent Age Grouping
This chart shows the age groupings of the people who completed the survey.
Key things to note:
The survey was predominantly completed by people between the ages of 55-64 years, followed by those over 65 years.
The spread of responses across all age groups was encouraging, however there was poor representation by those between the ages of 18-24 years.
Next >>