Facebook-f
Twitter
Youtube
Home
About
Overview
Project Objectives
Project Schedule
Steering Committee
Survey
Overview
Survey #1 Results
Overview
Profiling Charts
Participation in previous planning efforts
Respondent Age Grouping
Respondent Ethnicity
Respondent Identification
Relationship to City of Essex Junction
Annual Household Income
Home Ownership or Rental
Type of House
Respondent Residency
The City of Essex Junction
City of Essex Junction Reputation
City of Essex Strengths and Opportunities
City of Essex Weaknesses and Challenges
Living and working in the City of Essex Junction
Satisfaction about living/working in City of Essex Junction
What do you like most about living/working in the City of Essex Junction
What don’t you like about living/working in the City of Essex Junction
Future opportunities to grow and thrive in your life and interests
Future opportunities to grow and thrive in your career and/or business
Greatest future opportunities for the City of Essex Junction
Current Direction and Ability to Adapt
Satisfaction with current direction of the City of Essex Junction
Satisfaction with the City of Essex Junction’s ability to adapt
Changes, trends and opportunities that excite you about future of the City of Essex Junction
Changes, trends and opportunities that concern you about future of the City of Essex Junction
Survey #2 Results
Overview
Profiling Charts
Respondent Age Grouping
Respondent Residency
Housing and Urban Design / Development
Future Approach to Housing and Urban Design
Future Type of Housing and Urban Design
Economic and Business Development
Future Approach to Economic and Business Development
Future Retail and Commercial Development
Public Services and Facilities
Future Approach to Provision of Services
Most Important Services and Facilities Over the Next Five Years
Transportation and Connectivity
Future Approach to Transportation and Connectivity
Transportation and Connectivity Links of Most Interest
Environmental Stewardship
Future Approach to Environmental Stewardship
Most Needed and Urgent Aspects of Environmental Stewardship
Community Engagement and Decision Making
Future focus of community engagement in Essex Junction
The best way to engage the community in decision-making
Strategic Pillar Prioritization
Ranking pillars over the next 5 years
Which pillars will become more or less important over the next 5 years
Open House & Meal
Overview
Focus Groups
Overview
Think-Tank
Overview
Report
Voices of the Community Video
Agenda
Resources
Communications Toolkit
Reports
Think-Tank Report
Media Coverage
Essex Reporter Article 10-6-23
Junction City News Show
Newsletters
Newsletter 1: Oct. 20, 2023
Newsletter 2: Jan. 17, 2024
Newsletter 3: Mar. 27, 2024
Videos
Voices of the Community – Think-Tank
Contact Us
Menu
Home
About
Overview
Project Objectives
Project Schedule
Steering Committee
Survey
Overview
Survey #1 Results
Overview
Profiling Charts
Participation in previous planning efforts
Respondent Age Grouping
Respondent Ethnicity
Respondent Identification
Relationship to City of Essex Junction
Annual Household Income
Home Ownership or Rental
Type of House
Respondent Residency
The City of Essex Junction
City of Essex Junction Reputation
City of Essex Strengths and Opportunities
City of Essex Weaknesses and Challenges
Living and working in the City of Essex Junction
Satisfaction about living/working in City of Essex Junction
What do you like most about living/working in the City of Essex Junction
What don’t you like about living/working in the City of Essex Junction
Future opportunities to grow and thrive in your life and interests
Future opportunities to grow and thrive in your career and/or business
Greatest future opportunities for the City of Essex Junction
Current Direction and Ability to Adapt
Satisfaction with current direction of the City of Essex Junction
Satisfaction with the City of Essex Junction’s ability to adapt
Changes, trends and opportunities that excite you about future of the City of Essex Junction
Changes, trends and opportunities that concern you about future of the City of Essex Junction
Survey #2 Results
Overview
Profiling Charts
Respondent Age Grouping
Respondent Residency
Housing and Urban Design / Development
Future Approach to Housing and Urban Design
Future Type of Housing and Urban Design
Economic and Business Development
Future Approach to Economic and Business Development
Future Retail and Commercial Development
Public Services and Facilities
Future Approach to Provision of Services
Most Important Services and Facilities Over the Next Five Years
Transportation and Connectivity
Future Approach to Transportation and Connectivity
Transportation and Connectivity Links of Most Interest
Environmental Stewardship
Future Approach to Environmental Stewardship
Most Needed and Urgent Aspects of Environmental Stewardship
Community Engagement and Decision Making
Future focus of community engagement in Essex Junction
The best way to engage the community in decision-making
Strategic Pillar Prioritization
Ranking pillars over the next 5 years
Which pillars will become more or less important over the next 5 years
Open House & Meal
Overview
Focus Groups
Overview
Think-Tank
Overview
Report
Voices of the Community Video
Agenda
Resources
Communications Toolkit
Reports
Think-Tank Report
Media Coverage
Essex Reporter Article 10-6-23
Junction City News Show
Newsletters
Newsletter 1: Oct. 20, 2023
Newsletter 2: Jan. 17, 2024
Newsletter 3: Mar. 27, 2024
Videos
Voices of the Community – Think-Tank
Contact Us
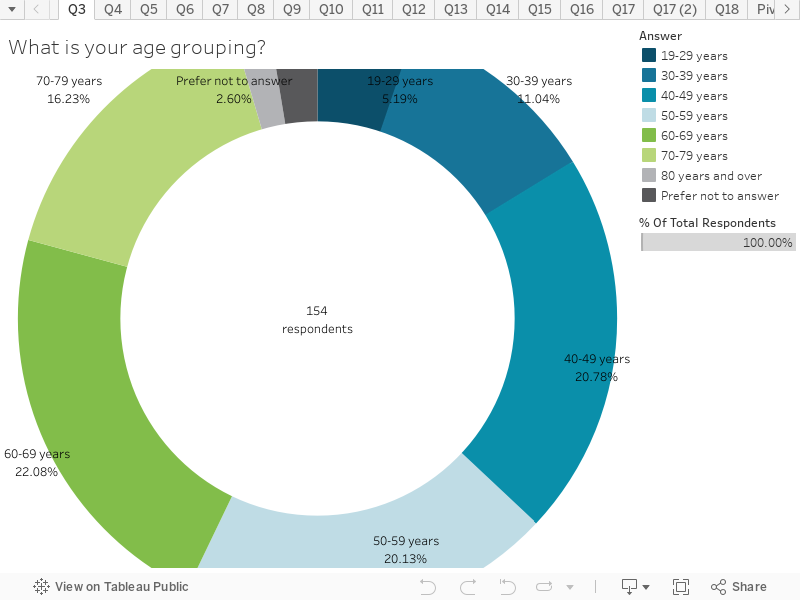
Respondent Age Grouping
This chart shows the age grouping of respondents.
Key things to note:
The majority of respondents were 60-69 years followed by 40-49 years.
There was a good spread of responses across all age groupings, with the exception of the under 19 age grouping which had no representation.
Next >>