Importance and Preparedness of Key Drivers to the future of East Central Iowa
Importance of Key Drivers (Y Axis) x Preparedness of Key Drivers (Y Axis)
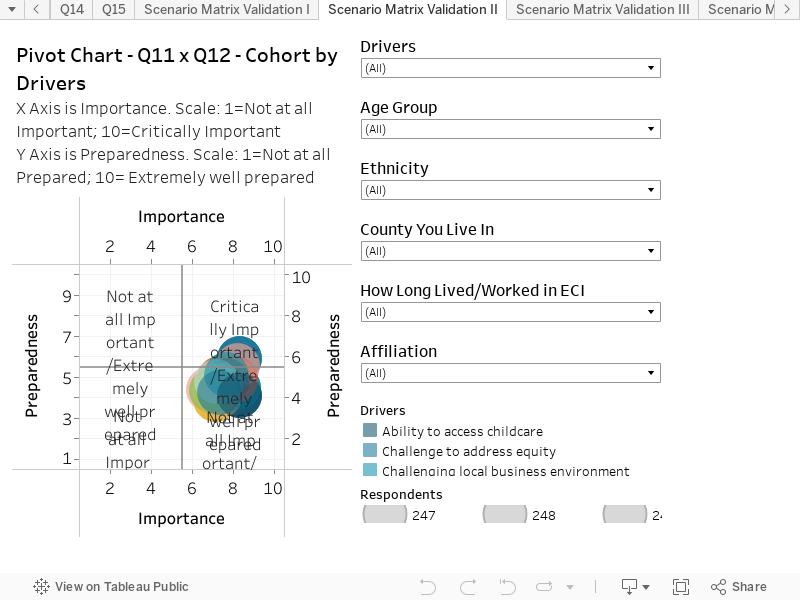
This chart combines responses to two questions to create an interactive scatter plot. This chart presents the average results based on all respondents. You can hover over the chart to reveal more information on each circle.
The chart is structured as follows:
Y-Axis is the response to the question “How Important are the following ‘drivers to the future of East Central Iowa?”. The scale is: 1 = Not at all important; 10 = Critically important
X-Axis is the response to the question “How well prepared is East Central Iowa to deal with future challenges and opportunities associated with each of these drivers?”. The scale is: 1 = Not at all prepared; 10 = Extremely well prepared
Key Things to Note:
The key insight from the survey data, is that all the drivers are seen as ‘Important’ (7-8 on scale); but almost all are scored in the ‘Not Prepared’ quadrant.
This chart can be filtered according to Drivers, Age Group, Ethnicity, County, time spent living or working in East Central Iowa and Stakeholder Affiliation.