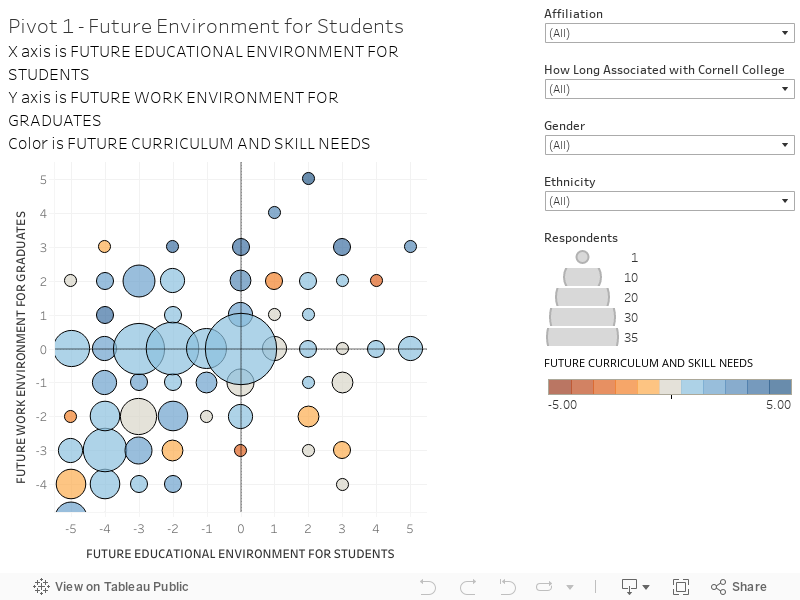
This chart combines responses to two questions to create an interactive scatter plot. This chart presents the results based on all respondents. You can hover over the chart to reveal more information on each circle. The chart is structured as follows:
X-Axis is the response to the question “When thinking about the future educational environment for students over the next 10 years, do you think the work at Cornell College will be more or less challenging?” The scale is -5 = Much more challenging; 0 = About the same; +5 = Much less challenging
Y-Axis is the response to the question “When thinking about the future work environment that graduates will face, do you think this will make the work at Cornell College more or less challenging?” The scale is -5 = Much more challenging; 0 = About the same; +5 = Much less challenging
Color Scale is the response to the question “When thinking about the future career and skill needs of graduates, do you think the type of education, curriculum, and skills that Cornell College currently emphasizes will become more or less useful? The scale is – 5 = Much less useful; 0 = About the same; +5 = Much more useful