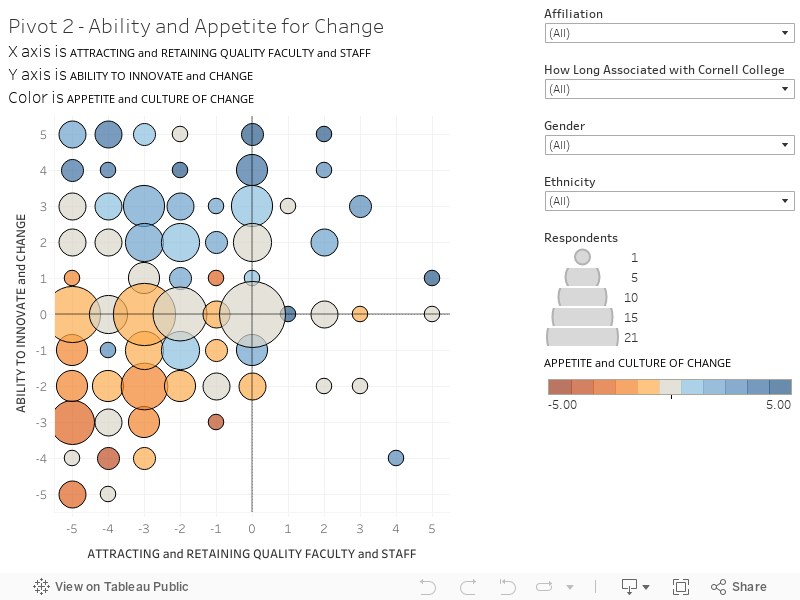
This chart combines responses to two questions to create an interactive scatter plot. This chart presents the results based on all respondents. You can hover over the chart to reveal more information on each circle. The chart is structured as follows:
X-Axis is the response to the question “A key to future success will be attracting and retaining quality educational talent: staff and faculty. Do you see this getting harder or easier over the next 10 years?”. The scale is -5 = Much harder; 0 = Staying the same; +5 = Much easier
Y-Axis is the response to the question “The educational landscape may be changing rapidly over the next decade, as new technologies emerge and new skill sets are required. This may drive the development of new and revised skills and resources. How well positioned are current faculty and staff to innovate and adapt to changes in the future educational landscape?” The scale is -5 = Very poorly positioned; 0 = Neutral; +5 = Very well positioned
Color Scale is the response to the question “In a rapidly changing world, having openness and interest for change is critical. Are current faculty and staff well-suited to embrace change? The scale is -5 = Very little appetite for change; 0 = Neutral; +5 = Very strong appetite for change