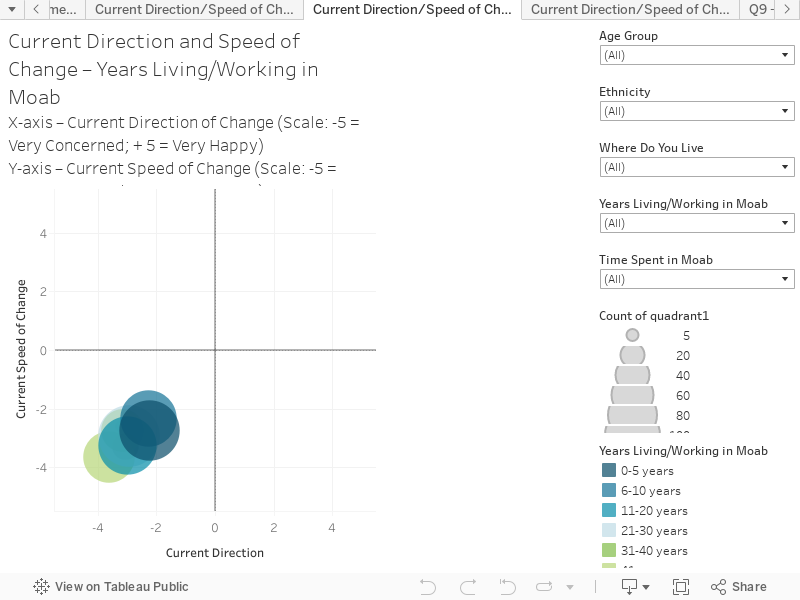
Direction and Speed of Change – Years Lived/Worked in Moab
Current Direction of Change (X Axis) x Current Speed of Change (Y Axis) This chart combines responses to two questions to create an interactive scatter plot. This chart presents the results based on years lived/worked in Moab. You can hover over the chart to reveal more information on each circle.
The chart is structured as follows:
X-Axis is the response to the question “How happy or concerned are you about the current direction of Moab?”. The scale is: -5 = Very Concerned; 0 = Neutral; +5 = Very Happy
Y-Axis is the response to the question “How happy or concerned are you about the current speed of change in Moab?”. The scale is: -5 = Very Concerned; 0 = Neutral; +5 = Very Happy
Key things to note:
The size of the bubble in the lower left quadrant at -5 indicates that this was the most popular response. The vast majority of respondents were Very Concerned about both the current direction and speed of change of Moab.
Those who had lived/worked in Moab for 41 or more years were most concerned about both the direction and speed of change. Interestingly, respondents who had lived/worked in Moab for 11-20 years were then the most concerned, followed by the other cohorts.
Those who had lived/worked in Moab for 0-5 years were more concerned about the speed of change than those who had lived/worked in Moab for a longer period (i.e. 6-10 years)
This chart can be filtered according to age grouping, residency, ethnicity, time spent in Moab each year and how long the individual has lived and worked in Moab.