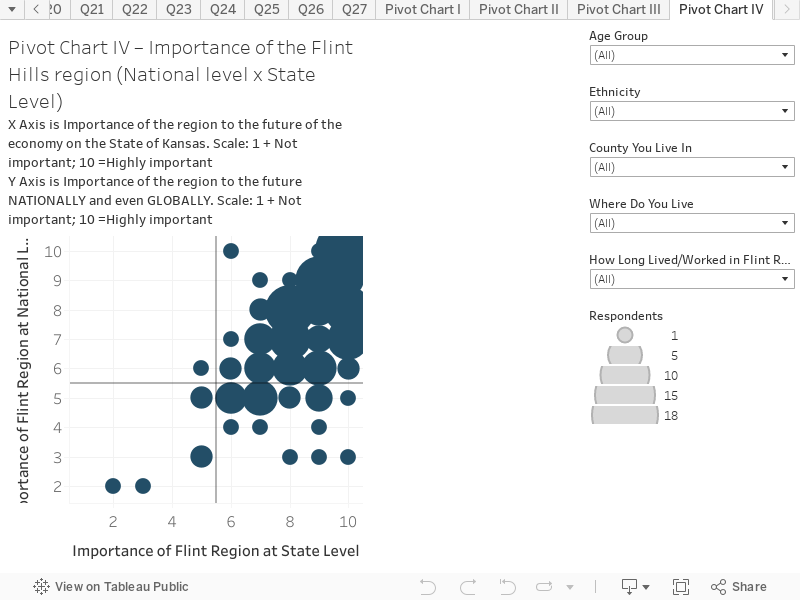
Importance of the Flint Hills region at State and National Levels
This chart combines responses to two questions to create an interactive scatter plot. This chart presents the results based on all respondents. You can hover over the chart to reveal more information on each circle. The chart is structured as follows:
X-Axis is the response to the question “Over the next 10-20 years, how important and relevant do you think this region could be to the future nationally and globally?” The scale is 1 = Not important; 10 = Highly important
Y-Axis is the response to the question “Over the next 10-20 years, how important and relevant do you think this region could be to the future of the economy of the State of Kansas?.” The scale is 1 = Not important; 10 = Highly important
Key things to note:
The size of the circle denotes the popularity of response. There was a wide spread of responses with the majority of respondents feeling that the Flint Hills region is important to highly important at both a state and national level, looking out over the next 10-20 years.
Use the filters on the right hand side to view how these results change depending on age cohort, ethnicity, county, type of residency and length of time spent living/working in the Flint Hills region.