Facebook-f
Twitter
Youtube
Home
About
Overview
Project Objectives
Project Schedule
Flint Hill Regional Council Members
Survey #1
Overview
Data Visualization
Profiling Charts
Zip Code
County of Residence
Where best describes where you live
Age Grouping
Ethnicity
Length of time living/working in Flint Hills region
Living & Working in the Flint Hills Region
Satisfaction Living / Working in the Flint Hills Region
What you like most about living / working in the Flint Hills Region
What you would change about living / working in the Flint Hills Region
Opportunities to grow and thrive in the Flint Hills Region
Future opportunities for living in the Flint Hills Region
Leading institutions and organizations in the Flint Hills region
Flint Hills Regional Vision & Values
Importance of a Shared Regional Vision for the Flint Hills region
Importance of Shared Regional Values for the Flint Hills region
Importance of a Shared Regional Plan for the Flint Hills region
Importance of a Regional Approach
Current Direction & Performance
Current Direction of the Flint Hills Region
Current Relative Performance of the Flint Hills Region
Changes & opportunities that excite you about the future of the Flint Hills Region
Changes & opportunities that concern you about the future of the Flint Hills Region
The word that describes the Flint Hills region today
The word that describes the Flint Hills region in 5 years’ time
Future Relevance & Importance of the Flint Hills Region
Importance and relevance of the Flint Hills region to the State of Kansas over next 10-20 years
Importance and relevance of the Flint Hills region nationally & globally over next 10-20 years
The future potential of the Flint Hills region
Interactive Charts
Satisfaction & Growth Opportunities in the Flint Hills Region
Importance of Shared Regional Plan and Values in the Flint Hills region
Current Direction and Performance of the Flint Hills region
Importance of the Flint Hills region at State and National Levels
Think-Tank
Overview
Part 1 Slide Deck
Part 2 Slide Deck
Think-Tank Report
Focus Groups
Overview
Resources
Project Trailer
Reports
Final Report
Executive Summary – Final Report
Think-Tank Report
Newsletters
Newsletter 1: Feb. 10, 2023
Newsletter 2: April 26, 2023
Newsletter 3: May 2, 2023
Newsletter 4: June 1, 2023
Contact Us
Menu
Home
About
Overview
Project Objectives
Project Schedule
Flint Hill Regional Council Members
Survey #1
Overview
Data Visualization
Profiling Charts
Zip Code
County of Residence
Where best describes where you live
Age Grouping
Ethnicity
Length of time living/working in Flint Hills region
Living & Working in the Flint Hills Region
Satisfaction Living / Working in the Flint Hills Region
What you like most about living / working in the Flint Hills Region
What you would change about living / working in the Flint Hills Region
Opportunities to grow and thrive in the Flint Hills Region
Future opportunities for living in the Flint Hills Region
Leading institutions and organizations in the Flint Hills region
Flint Hills Regional Vision & Values
Importance of a Shared Regional Vision for the Flint Hills region
Importance of Shared Regional Values for the Flint Hills region
Importance of a Shared Regional Plan for the Flint Hills region
Importance of a Regional Approach
Current Direction & Performance
Current Direction of the Flint Hills Region
Current Relative Performance of the Flint Hills Region
Changes & opportunities that excite you about the future of the Flint Hills Region
Changes & opportunities that concern you about the future of the Flint Hills Region
The word that describes the Flint Hills region today
The word that describes the Flint Hills region in 5 years’ time
Future Relevance & Importance of the Flint Hills Region
Importance and relevance of the Flint Hills region to the State of Kansas over next 10-20 years
Importance and relevance of the Flint Hills region nationally & globally over next 10-20 years
The future potential of the Flint Hills region
Interactive Charts
Satisfaction & Growth Opportunities in the Flint Hills Region
Importance of Shared Regional Plan and Values in the Flint Hills region
Current Direction and Performance of the Flint Hills region
Importance of the Flint Hills region at State and National Levels
Think-Tank
Overview
Part 1 Slide Deck
Part 2 Slide Deck
Think-Tank Report
Focus Groups
Overview
Resources
Project Trailer
Reports
Final Report
Executive Summary – Final Report
Think-Tank Report
Newsletters
Newsletter 1: Feb. 10, 2023
Newsletter 2: April 26, 2023
Newsletter 3: May 2, 2023
Newsletter 4: June 1, 2023
Contact Us
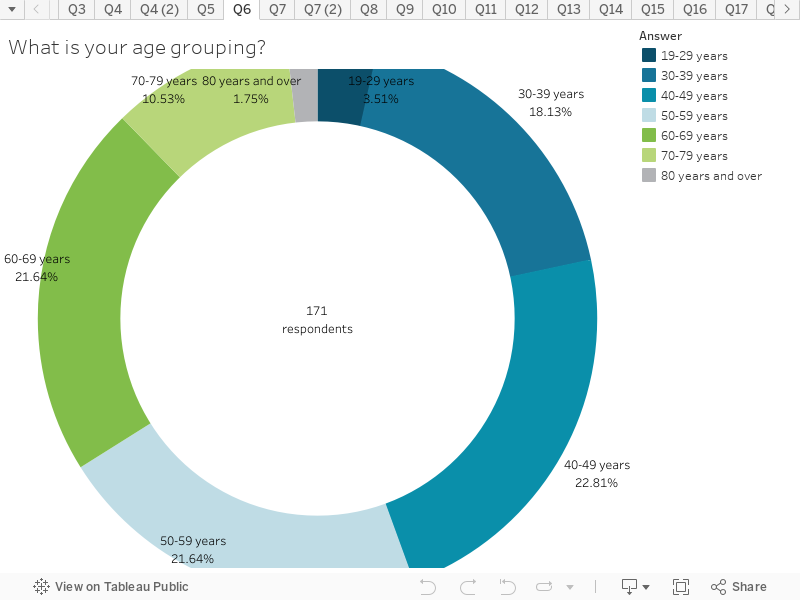
Age Grouping
This chart shows the age groupings of the survey respondents.
Key things to note:
There is a similar amount of survey respondents between the ages of 30 – 59.
There is a noticeabley smaller amount of survey respondents over 80 years and between 19-29 years.
<< Previous
Next >>